1. 引言
随着我国经济的飞速发展,城市规模的不断扩大,大气污染日益严重,成为首要的社会问题之一,环境空气质量和整个生态系统和人类健康息息相关 [1] 。对于空气污染问题不同学者从不同角度进行了研究 [2] - [13] 。例如,王淑芸等 [2] 对河北沧州市空气质量及其污染物进行了统计分析,发现沧州市空气质量优良的天数居多,影响沧州市空气质量的首要污染物为PM10,其次为SO2,空气质量受季节影响较为严重。Jassim等 [3] 通过EPA方法识别对巴林岛空气质量有影响的最重要的污染物,并将气象因素的影响纳入了考虑范围,得出PM2.5浓度在一些工业城市更高的结论。Jarauta-Bragulat等 [4] 提到空气质量指数(AQI)与一些污染物相关,而这些污染物又是各自浓度一种转化的计算,第一次提出将整合合成数据应用到空气质量表达的方法。Gocheva-Ilieva等 [5] 应用因子分析和Box-Jenkins方法检查保加利亚主要污染物的浓度以及布拉戈耶夫格勒镇臭氧浓度,用时间序列分析和ARIMA方法,短期预测空气污染并对一些城区起到提醒作用。雷正翠等 [6] 对2001-2006年常州空气质量的变化特点进行了统计分析,分析了气象条件对常州空气污染的影响和贡献程度。毕丽玫,史建武等 [8] 用皮尔逊相关系数分析了温度、湿度、气压、风速、能见度对 SO2,NO2,PM10,PM2.5的相关性,并以此说明气象环境对污染物浓度的影响。Lu和 Fang [9] 使用三个不同分布(正态对数分布、威布尔分布、皮尔逊V型分布)分析PM2.5、PM10和风速之间的关系,研究表明PM值与风速之间的反向相关关系可用某个关系式表示。朱奕 [10] 对污染物进行了后向气团轨迹分析,发现气象条件对颗粒污染物的浓度有着显著影响,且除本地排放外,来自中东部污染严重城市的区域性气流输送是导致长沙市颗粒物污染的重要原因。徐小丽 [11] 运用主成分分析法(PCA)探讨西安市及伦敦市的空气质量监测指标中多种污染物与PM2.5的相关性,结果表明:PM10与PM2.5最相关,同时,利用多重分形分析发现西安市和伦敦市有着共同特点。Kumar A等 [12] 通过以PCA为基础的神经网络预测印度德里AQI的日均数据,结果显示PCA神经网络要优于神经网络预测。
然而,上述研究大多针对影响空气质量的特定两个变量的相互关系进行研究,所用的方法主要是简单的相关分析。这种分析只考虑两变量间的相互作用,没有考虑其他变量对它们的影响。然而,系统内所有变量之间的相互作用在一定程度上可能掩盖待研究的两变量间的关系。例如,当两变量的简单相关系数较大时,有时并不是这两个变量本身的内在联系所决定的,它可能是由另外一些变量对它们的共同作用造成的,因此简单的相关系数不能真正反映两个变量间的线性相关程度。大气污染是一个多因素控制的、复杂的系统问题,在研究多变量的情况下,一个要素的变化往往影响到其它要素的变化,即各个空气污染指标之间具有高相关性,互相影响,因此与AQI的相关程度会受到其他指标的影响。基于此本文引进偏相关分析对AQI的影响因素进行研究。当考察两个变量之间的线性相关关系时,偏相关分析能控制其他变量对它们的影响,能有效揭示这两个变量之间的真实相关程度 [14] 。然而,在空气质量的研究中,利用偏相关分析的研究报道不多,且仅针对单一地区进行研究。例如,王涛等 [15] 利用偏相关分析描述PM2.5、PM10与NO2、SO2的关系,结果表明江苏省的二次PM2.5主要源自的SO2的气–粒转化过程,固定污染源的间接贡献较大;PM10更多源自固定污染源而非移动污染源。徐莲等 [16] 针对NO2、O3两种特征性大气污染物,在总结出一般性的污染变化规律的基础上,进一步采用偏相关分析方法,证实了NO2是生成O3的重要前体污染物。
当研究了AQI与各个影响因素的真实相关程度后,为其建立短期回归预测模型是另一个重要的工作。然而,利用多个自变量建立回归模型时,若试图将所有的自变量都引进回归模型,往往不能对其进行有效的解释,因此需要挑选出对因变量有显著影响的自变量。逐步回归分析是一个有效剔除冗余变量的方法,该方法通过将前进法和后退法结合,保证了最后所得的回归子集是最优回归子集 [14] 。
此外,现有的文献大多以空气污染指数(API)为标准,研究大气污染问题,随着2012年国家环保部门修订了空气质量的测量标准,首次将PM2.5、NO2等物质纳人到空气质量勘测的范畴,研究AQI将能更准确反映环境的实际状况,预测AQI成为现在空气质量研究领域的一个话题 [17] [18] 。基于以上分析,本文试图利用偏相关分析与逐步回归来研究AQI与各空气污染指标的影响情况及对其进行短期预测。
本文选取中国三个城市作为研究对象,分别是首都北京,内陆城市长沙,沿海城市海口,以三个城市的AQI及PM2.5等6种污染指标数据为基础,利用偏相关分析研究6种污染指标对AQI的影响情况,并通过逐步回归分析获得上述三个城市的AQI回归方程,最后有针对性地提出改善城市的空气质量的建议。
2. 方法与数据
2.1. 偏相关分析
偏相关分析又称净相关分析,能够有效地控制其他变量影响条件下揭示两变量之间净相关的强弱程度。偏相关系数绝对值越接近1,表示两变量关系越密切,影响程度越大;越接近0,相关性越小 [14] 。因此偏相关系数能定量描述AQI与每一种空气污染指标的真实相关程度。通过求出AQI与各影响因素间的偏相关系数并进行检验,即可以得到影响AQI的主要因素。偏相关系数计算过程 [19] 如下:控制了变量x2,变量x1和y的偏相关系数为:
 (1)
(1)
式中 分别表示y和x1,y和x2及x1和x2的相关系数。
控制两个变量 时,变量
时,变量 之间的偏相关系数为
 (2)
(2)
式中 为控制变量
为控制变量 时,变量
时,变量 与
与 的偏相关系数;
 为控制变量
为控制变量 时,变量
时,变量 与
与 的偏相关系数,依此类推。
当控制变量有3个或3个以上时,计算变量之间的偏相关系数依照式(1)、(2)类推。
2.2. 偏相关系数的检验
当要素之间的相关系数求出之后,还需要对其进行显著性检验。由于抽样误差的存在,样本中控制了其它变量的影响,两个变量间偏相关系数不为0,不能说明在总体中这两个变量间便相关,此时须进行进一步检验,一般使用t检验方法 [20] 。
 (3)
(3)
式中:r是相应的偏相关系数,n是观测量数,k是控制变量的数量,自由度 。选定显著性0.05,当
 时拒绝原假设,认为变量间有显著的线性关系。
2.3. 逐步回归分析
逐步回归法是在前进法和后退法基础上,进行双向筛选的一种方法,它的基本思想是“有进有出”。具体做法是:将变量一个一个引入,每引入一个变量后,对已选入的变量进行逐个检验,当原引入的变量由于后面变量的引入而变得不再显著时,将其剔除。引入一个变量或从回归方程中剔除一个变量,为逐步回归的一步,每一步都需进行F检验,直到既无显著的自变量选入回归方程,也无不显著的自变量从回归方程剔除为止。这样就弥补了前进法和后退法的缺陷,保证了最后所得的回归子集是最优回归子集 [21] 。
2.4. 数据来源
本文选取北京、长沙、海口的AQI和PM2.5、PM10、SO2、CO、NO2、O3浓度数据来源于空气质量历史数据网站(https://www.aqistudy.cn/historydata/daydata.php)。选取2013年12月~2016年11月AQI与PM2.5、PM10、SO2、CO、NO2、O3 6种参评污染物的日均浓度,每个城市都收集了共1095天的数据。在下面的分析中,AQI为因变量,6种大气污染指标为自变量。
3. AQI与6种污染指标的偏相关分析
利用SPSS23.0对AQI及6种污染物做偏相关分析,控制其他5种变量,计算出AQI与每种污染指标两两间的偏相关系数。以海口市为例,结果如表1~6所示。
由表7可知,北京的AQI与PM2.5、PM10、NO2、O3的偏相关系数通过检验,即北京AQI的主要污染源为PM10、PM2.5、NO2和O3;长沙AQI的主要污染源为PM10、PM2.5、NO2和CO。而海口AQI的主要污染源为PM10、PM2.5和SO2。由此可看出,这三个城市影响空气质量的大气污染源存在差异,
表1. AQI与PM2.5偏相关性
Table 2. Partial correlation between the AQI and PM10
表2. AQI与PM10偏相关性
Table 3. Partial correlation between the AQI and SO2
表3. AQI与SO2偏相关性
Table 4. Partial correlation between the AQI and CO
表4. AQI与CO偏相关性
Table 5. Partial correlation between the AQI and NO2
表5. AQI与NO2偏相关性
Table 6. Partial correlation between the AQI and O3
表6. AQI与O3偏相关性
Table 7. Results of the partial correlation analysis for the AQI and six factors in the three cities
表7. 三个城市AQI与6种大气污染物的偏相关分析综合结果
北京、长沙的PM2.5对AQI的影响最大,这是因为PM2.5粒径小,富含大量的有毒、有害物质且在大气中的停留时间长、输送距离远,因而对人体健康和大气环境质量的影响更大。而海口的PM10对AQI的影响最大,文献 [22] 通过对海口市大气颗粒物来源进行源解析,发现PM10的主要源类为机动车尾气尘、城市扬尘、建筑水泥尘,这主要与海口市无取暖季、机动车保有量及机动车类型有关。大部分沿海地区受到大气环流的影响,对海陆空气污染的形成和运输具有重要的影响,可以混合不同的气团 [21] ,其污染的来源构成和形成机制可能不同于内陆地区。
4. AQI与6种大气污染物的逐步回归分析
本节通过逐步回归分析对这三个城市分别建立AQI的预测方程。在如何挑选出对AQI有显著影响的自变量的问题上,由于逐步回归吸收了前进法和后退法的优点,克服了它们的不足,保证了最后所得的回归子集是最优回归子集。
空气质量评价的主要污染物为PM2.5、PM10、SO2、CO、NO2、O3,AQI由其含量计算所得。下面运用SPSS23.0统计软件对AQI与上述6种污染物进行逐步回归,取引入自变量的显著性水平 ,剔除自变量的显著性水平
 ,海口逐步回归的结果如表8所示。
由表8可知,逐步回归的最优子集为模型3,即PM10,PM2.5,SO2。仅PM2.5、PM10、SO2对AQI有重要的影响进入方程,其余3个自变量对AQI影响均不显著被剔除。即PM2.5、PM10、SO2对AQI的影响显著,具有统计学意义,这个结果与偏相关的结果一致。且决定系数R2 = 0.970,说明在逐步拟合的线性回归方程的因变量AQI能被自变量解释的占97%。
由表9可知,通过逐步回归分析,海口AQI的最优多元线性回归方程为:
 (4)
(4)
P = 0.000 < 0.05,说明在显著水平为0.05的情况下回归系数通过t检验,PM10,PM2.5,SO2对AQI的线性影响均显著。
由表10可知,F = 11706.377,p = 0.000 < 0.05,说明在显著水平为0.05的情况下回归方程通过F检验,线性回归效果显著,逐步回归方程具有统计意义。该方程可用于海口AQI的预测。用同样的方法对北京和长沙的因变量AQI和自变量进行逐步回归,北京AQI的最优子集为PM2.5、PM10、NO2和O3,最优多元线性方程为
表8. 模型摘要
注:a. 预测变量:(常量),PM10;b. 预测变量:(常量),PM10,PM2.5;c. 预测变量:(常量),PM10,PM2.5,SO2
表9. 回归系数表
注:因变量:AQI,B指回归系数和截距,左边对应常数代表截距,对应变量代表回归系数。
表10. 方差分析
注:a. 因变量:AQI;b. 预测变量:(常量),PM10;c. 预测变量:(常量),PM10,PM2.5;d. 预测变量:(常量),PM10,PM2.5,SO2。
 (5)
(5)
长沙AQI的最优子集为PM2.5、PM10、CO和NO2,最优多元线性方程为
 (6)
(6)
三个城市回归方程检验p值都为0.000 < 0.05,线性回归效果显著,且拟合优度好,回归系数均通过检验。综合三个城市的偏相关分析,逐步回归选取的最优子集与偏相关系数显著的自变量吻合。
5 模型检验
5.1. 回归模型精度分析
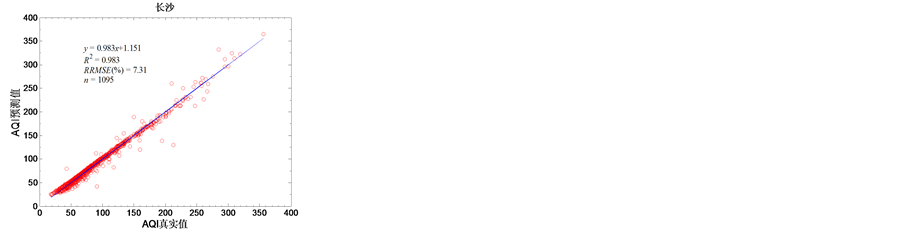
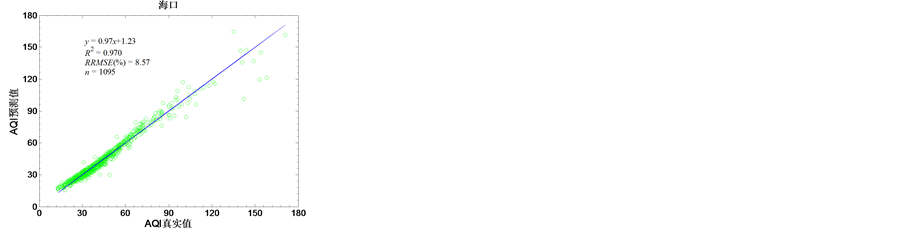
为了检验建立的上述三个城市回归模型的有效性,我们首先来考察模型精度,利用相对根误差(RRMSE)来描述模型精度,如式(7)所示。利用式(4)~(6)求出训练样本中1095天(2013年12月~2016年11月)AQI的预测值,将其与AQI真实值比较,如图1所示。从图中可以看出:三个城市的AQI训练数据的真实值与预测值决定系数都达0.97以上,模型的拟合优度较高,其预测值基本分布在真实值周围,且相对均方根误差均小于12%,预测精度较高,尤以长沙的回归效果最佳。
 (7)
(7)
式中: 为预测值,
为预测值, 为真实值,
为真实值, 为样本个数。
5.2. 预测模型误差分析
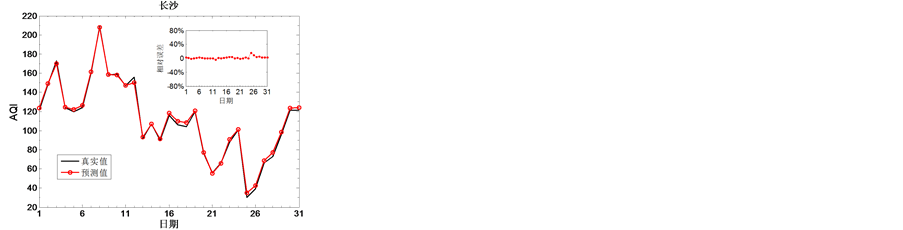
为了考察回归模型的预测效果,利用求得的三个回归预测方程对三个城市的2016年12月的AQI进行预测,并与真实数据作比较,如图2所示。为了定量描述预测误差,真实值与预测值的相对误差也显示在图2中。从图中可以看出,除极少数点外,北京和海口的预测相对误差都在10%以内,而长沙的预测相对误差在5%以内,说明上述回归方程的预测效果较好,其相对误差较平稳,波动较小。表明本文提出的最优线性回归方程用于预测短期AQI是可靠的。

 (a) (b) (c)
Figure 1. The predictive results of AQI for (a) Beijing; (b) Changsha and (c) Haikou in December, 2013 to November, 2016. The solid lines denote the true value, beside them are the model evaluations
图1. (a) 北京、(b) 长沙、(c) 海口三个城市2013.12~2016.11月AQI的预测结果,实线代表真实值,其旁边的参数表示模型评价结果

 (a) (b) (c)
Figure 2. The predicative results of AQI for (a) Beijing; (b) Changsha and (c) Haikou in December, 2016. The main plot is true values and predicative values. Insect is relative error
图2. (a) 北京、(b) 长沙、(c) 海口三个城市2016年12月AQI预测结果,主图是真实值与预测值,子图是相对误差
6. 结果分析及建议
在本文的研究中,我们发现北京、长沙、海口三个城市影响空气质量的大气污染源存在差异。对于北京和长沙两个城市,PM2.5对AQI的影响最大;而海口的PM10对AQI的影响最大。这说明空气质量污染主要还是煤燃烧,工业排放的废气,城市扬尘,汽车尾气,建筑水泥尘等。三个城市的大气主要污染物都包含PM2.5和PM10,且与AQI的关系密切,在控制大气污染上,防治细颗粒物污染尤为重要。提出的回归预测方程能用于AQI的短期预测,误差较小,模型可靠。
为了进一步地改善城市环境空气质量,提出以下几点建议:
1) 在本文的研究中,三个城市影响空气质量的大气污染源存在差异,即不同城市的大气污染影响因素不同,在控制大气污染上,不同城市的治理方案应该有所差异和侧重,有针对性地提出改善方案效果会更好。
2) 改变能源消耗结构,推动节能减排;强化工业污染源排放的监管工作,不达标的排放物不能轻易排放;提高工程项目的申报标准;强化城市建设道路施工和扬尘的控制,强化道路运输车辆管理,加强道路洒水降尘工作。
3) 优化产业结构和布局。将重工业行业向外转移,同时大力发展金融服务业、医疗服务业、教育产业和高新技术业等,来达到既减少能源需求和污染物排放,又保证经济的持续增长和充分就业的目的,缓解环境保护与经济发展之间的矛盾。
4) 控制汽车增长率,大力发展新能源公用交通工具,提倡绿色出行;进一步完善地铁线路,错峰出行,降低汽车尾气排放。
5) 加大城市緑化美化,增大绿地面积和绿化覆盖率。严格控制低质煤炭的销售和使用,特别是城市居民取暖用煤。
6) 污染物的区域传输也是影响城市空气质量的一个原因 [23] [24] ,因此对于空气污染的治理,还要注意外源输送的影响。
基金项目
本文由湖南省社科基金项目(15YBA204)和湖南农业大学大学生科创项目(XCX16005)资助。
NOTES
*通讯作者。