1. 引言
ShakeMap系统由美国地质调查局开发,能够在震后自动、快速地生成地震动峰值(PGA/PGV)等值图和仪器烈度分布图等产品,通过这些产品人们可以很直观地了解到哪里可能遭受的震动最强烈、破坏最严重,这为震后应急救援策略的制定和应急救援工作的展开提供科学依据和一定的参考意见。与此同时,丰富多样的ShakeMap产品还可以通过网络、移动电话和电视媒体等多种途径进行发布传播,因而公众可以在震后迅速地获得最新的地震信息,这对于维持社会稳定,避免因地震引发的慌乱,也将起到重要的作用。
ShakeMap是一套比较成熟的烈度速报系统,在美国甚至全球范围内有着广泛的应用,如在美国加州、内达华州、犹他州、夏威夷、阿拉斯加、新马德里和美国国家地震信息中心(NEIC)等都在使用ShakeMap系统,国际上如意大利等也在使用ShakeMap系统,而国内也有一些科研院所或机构在直接应用ShakeMap或进行二次开发。目前,国内相关研究不断发展成熟、理论水平也随之得到提高,地震观测台网密度不断加大,这些都为国内引进和应用ShakeMap系统打下比较坚实的基础。如何将ShakeMap系统与国内实际情况相结合,实现ShakeMap系统的区域化应用、保证处理结果真实可靠和产品内容丰富易懂等正是本文所要解决的问题。
2. ShakeMap系统简介
2.1. 系统概况
ShakeMap系统的研究开始于美国1994年北岭地震之后,最初由David Wald构想。1996年加州地震台网(Wald and others, 1997)和新安装的TerraScope台网(Kanamori and others, 1991) [1] 的结合,造就了足够数量的实时强震观测台站,David Wald和Vincent Quitoriano也因此得以在同年设计和实现ShakeMap系统。基于ShakeMap系统的实用性,ShakeMap系统随着TriNet系统的发展、增强和扩展也不断演化。在南加州的成功应用,使得美国政府在不遗余力的增强ShakeMap系统软件的同时也在美国国内其它州推广这一系统。Bruce Wald (Caltech,现为USGS)和Craig Scrivner (前CDMG,加州矿产和地质部)对软件进行了重新设计。后续软件的开发作为ANSS的一部分在Worden和Quitoriano指导下进行 [2] [3] 。之后,ShakeMap系统的应用范围从美国国内其它地震活跃的州不断扩大到全球范围内的许多国家和地区。现在ShakeMap系统主要由USGS负责运营,可以处理几乎全球范围内的地震。
ShakeMap系统主要由perl语言编写,同时依赖于第三方软件,比如:使用GMT(Generic Mapping Tools,Will Smith) [4] [5] [6] [7] [8] ,一款通用制图工具进行部分计算和绘图使用MySQL数据库存储地震信息和一些运行参数,使用Subversion管理系统的各个版本,使用zip对产品进行压缩便于提供ftp下载等。
ShakeMap系统的产品非常丰富,主要包括:峰值加速度等值线图,峰值速度等值线图和仪器烈度分布图等图形产品;GIS产品可用于灾害评估,KML,KMZ文件配合可加载与GoogleEarth的强大功能,方便人们直观地了解到地震的破坏情况;ShakeMap系统的产品发布方式也比较灵活多样,产品可以通过网页、电视媒体、电子邮件和ftp站点等方式展现给公众。
ShakeMap系统的主要用途包括:1) 应急救援与损失评估2) 公众信息与教育3) 地震工程与地震研究4) 地震模拟演练。
2.2. 主要模块及处理流程
ShakeMap系统由一系列功能模块组成,如数据提取模块、计算模块、绘图模块、网页生成模块、打印模块和邮件通知模块等,模块之间相互调用完成系统对地震事件的处理与发布。图1为ShakeMap系统的处理流程图。
图1表1为系统的主要模块及功能说明。当地震台网记录到一个地震事件时,在把地震三要素和台站等数据传给ShakeMap的同时会触发ShakeMap系统,ShakeMap的retrieve程序根据台站传来的数据生成系统运行的event.xml和*_dat.xml等文件(输入),然后经过grind的计算处理后,交给mapping绘图,然后由genex生成相关的网页产品(处理),通过transfer传送到相关web和ftp站点供网页显示与下载,最后由shakemail发送邮件通知和print进行打印(输出) (图2)。
表1图23. 区域化应用
3.1. 福建地区台网简介
福建地震观测台网在“十一五”之前由41个测震台站和1个测震台网中心组成,其中41个测震台
Figure 1Figure 1图1. ShakeMap系统基本流程图
图1Figure 2Figure 2图2. ShakeMap模块调用流程
图2
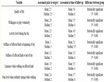
Table 1. Modules and functions of ShakeMap
Table 1. Modules and functions of ShakeMap
Table 1Table 1表1. ShakeMap的模块及其功能
表1站分别为3个国家测震台、30个区域测震台和8个水库台网测震台。“十一五”期间,增加建设 84个地震台站,目前整个台网中心共有强震和测震台站125个。其中31台配置速度型地震仪,40台配置加速度型地震仪,54台同时配置速度型地震仪与加速度型地震仪,且台站全部为2M专线实时传输。建成后的新台网使得福建全省每个县至少有一个地震观测台站,台站间距在30公里左右(图3),监测能力大大提高。
图33.2. 应用方案
由于台网建设、数据传输方式、数据采集和管理方式不同,ShakeMap系统原有数据接收及地震事件监测等模块在福建省数字台网中无法正常运行,需要编写相应模块保证正常的数据接收;此外,ShakeMap系统使用xml文件及与NetCDF兼容的数据格式文件等进行数据的处理,因此需要对现有数据进行转换才能为ShakeMap系统所用。本文给出的应用方案如图4所示。关于这个图的说明也没有,让人很难理解,建议进行简单论述。首先,系统监测模块在监测到地震事件后,若满足处理要求将自动将地震信息
图4
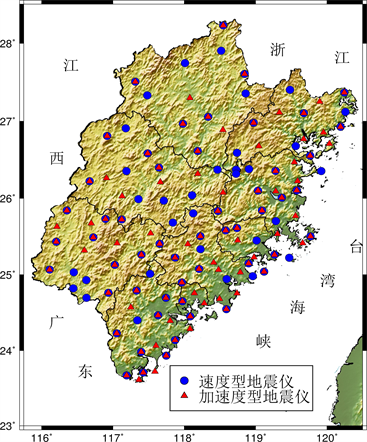
Figure 3. Seismic monitoring network of Fujian Province
Figure 3. Seismic monitoring network of Fujian Province
图3. 福建地震监测台网
图3Figure 4Figure 4图4. 区域应用方案
图4和数据进行保存,然后数据接收转换模块会将接受到的数据转换为ShakeMap要求的格式,并触发改造后的ShakeMap运行,绘图图片生成网页并进行产品发布。由于地震动衰减和烈度计算等方法具有较强的区域性,因此本文使用国内前人在此方面的研究成果对ShakeMap系统原有模块进行替换,期望获得反映出地震动真实情况的产品。
3.3. 主要模块
3.3.1. 地震动衰减关系
本文将ShakeMap系统应用于福建地区时,采用了更加符合国内实情的地震动衰减关系(见表2)替换系统原有地震动衰减。
表2对于0~4.0级范围内的地震,本文采用金星等人对福建地区中小震所统计的衰减关系(金星等,2008) [9] ,其形式如(1)所示:
(1)
log
10
Y
=
B
1
+
B
2
×
(
R
+
10
)
+
B
3
×
R
+
B
5
×
M
log
10
log
log
10
10
Y
=
B
1
+
B
2
×
(
R
+
10
)
(
R
+
10
R
+
10
)
+
B
3
×
R
+
B
5
×
M
(1)其中,Y是加速度峰值PGA(gal)或速度峰值PGV (cm/s);R是震中距,M为震级。
本文将该衰减关系的使用范围定义为:0~4.0级;
B1~B5(水平分量)的值如下表所示:
对震级范围为4.1 < M ≤ 6.4的衰减关系,本文采用康蓝池等人(康兰池,2010)对于四川地区基岩场地地震动峰值统计得到的衰减规律 [10] 。之所以选用这个衰减关系一方面是由于福建地区没有大震记录,另一方面是由于它是国内首个提出的震级在该范围内的衰减关系,比国外衰减关系能较好地反映出真实的地震动情况。其衰减关系式如(2)所示:
(2)
log
10
Y
=
B
1
+
B
2
×
M
+
(
B
3
+
B
5
×
M
)
×
log
(
R
+
10
)
log
10
log
log
10
10
Y
=
B
1
+
B
2
×
M
+
(
B
3
+
B
5
×
M
)
(
B
3
+
B
5
×
M
B
3
+
B
5
×
M
)
×
log
(
R
+
10
)
(
R
+
10
R
+
10
)
(2)其中,Y是PGA(gal)或PGV(cm/s);R是震中距,M为震级。
本文在实际使用时将其适用范围定义为:4.1~6.4级;
关系式中 B1~B5(水平分量)的值如下表所示:
同样,由于福建地区没有大震衰减关系,而国内相关方面的研究甚少,因此在实际应用中,大震方面本文仍然使用ShakeMap系统自有的用于大震的衰减关系Hazus PGV。该衰减关系是利用给定的震级和到震中一定距离得到PGA/PGV/SA,该衰减模型来自于Boore and others (1997)等人的研究 [11] ,其关系式如(3)式所示:
Table 2. Attenuation relationship of ground motion used in Fujian
Table 2. Attenuation relationship of ground motion used in Fujian
Table 2Table 2表2. 应用于福建地区的地震动衰减关系
表2
(3)
ln
(
PGA
,
PSA
)
=
B
1
+
B
2
(
M
−
6
)
+
B
3
(
M
−
6
)
2
−
B
5
ln
(
R
)
−
B
v
×
ln
(
V
s
/
V
a
)
ln
(
PGA
,
PSA
)
(
PGA
,
PSA
PGA
,
PSA
)
=
B
1
+
B
2
(
M
−
6
)
(
M
−
6
M
−
6
)
+
B
3
(
M
−
6
)
2
(
M
−
6
)
(
M
−
6
)
(
M
−
6
M
−
6
)
2
−
B
5
ln
(
R
)
(
R
)
−
B
v
B
v
×
ln
(
V
s
/
V
a
)
(
V
s
/
V
a
V
s
/
V
a
V
s
V
s
V
s
/
V
a
V
a
V
a
)
(3)其中,
,PGV从使用Newmark-Hall, 1982公式计算的1Hz PSA计算而来,R是“Joner-Boore”距离。
R
=
R
j
b
2
+
h
2
R
=
R
j
b
2
+
h
2
R
j
b
2
+
h
2
R
j
b
2
R
j
b
j
b
2
+
h
2
h
2
B1~B5、Bv和Va等参数的值如下表所示:
va3.3.2. 场地校正
由于福建地区钻孔资料较少,故场地校正仍然使用ShakeMap系统的场地校正方法,即用地形高程数据(SRTM)求出该区域的平均坡度,然后根据Wald等人统计的地形坡度、场地分类和地表以下30米的平均剪切波速之间的关系式可以估计得到福建区域的Vs30分布图(图5),最后利用Borcherdt (1994)的方法即可求出PGA, PGV的场地放大因子,进而可以对PGA、PGV进行初步的场地校正,获取反映出地震动的真实情况的产品 [12] [13] [14] [15] 。
图53.3.3. 仪器烈度
为了更清晰地反映出地震动分布情况,Wald et al. (1999)提出由仪器观测得到的地震动记录计算出地面烈度的方法,即ShakeMap仪器烈度。Wald et al. (1999)又挑出加州所发生的8次比较重大的地震,由当地地震网记录的强震记录结合各地地震大量的实际观测以及网络志愿值反馈的烈度调查,给出了PGA、PGV等地震动峰值和修正的麦卡利烈度(Modified Mercalli Intensity, MMI)之间的回归关系式,并给出仪器烈度的计算公式 [16] ,如下所示:
(4)
I
m
m
=
{
3.66
log
(
PGA
)
−
1.66
(
sigma
=
1.08
)
3.47
log
(
PGV
)
+
2.35
(
sigma
=
0.98
)
2.20
log
(
PGA
)
+
1.00
2.10
log
(
PGV
)
+
3.40
I
m
m
I
m
m
m
m
=
{
3.66
log
(
PGA
)
−
1.66
(
sigma
=
1.08
)
3.47
log
(
PGV
)
+
2.35
(
sigma
=
0.98
)
2.20
log
(
PGA
)
+
1.00
2.10
log
(
PGV
)
+
3.40
{
3.66
log
(
PGA
)
−
1.66
(
sigma
=
1.08
)
3.47
log
(
PGV
)
+
2.35
(
sigma
=
0.98
)
2.20
log
(
PGA
)
+
1.00
2.10
log
(
PGV
)
+
3.40
3.66
log
(
PGA
)
−
1.66
(
sigma
=
1.08
)
3.47
log
(
PGV
)
+
2.35
(
sigma
=
0.98
)
2.20
log
(
PGA
)
+
1.00
2.10
log
(
PGV
)
+
3.40
3.66
log
(
PGA
)
−
1.66
(
sigma
=
1.08
)
3.66
log
(
PGA
)
−
1.66
(
sigma
=
1.08
)
3.66
log
(
PGA
)
−
1.66
(
sigma
=
1.08
)
3.66
log
(
PGA
)
(
PGA
PGA
)
−
1.66
(
sigma
=
1.08
)
(
sigma
=
1.08
sigma
=
1.08
)
3.47
log
(
PGV
)
+
2.35
(
sigma
=
0.98
)
3.47
log
(
PGV
)
+
2.35
(
sigma
=
0.98
)
3.47
log
(
PGV
)
+
2.35
(
sigma
=
0.98
)
3.47
log
(
PGV
)
(
PGV
PGV
)
+
2.35
(
sigma
=
0.98
)
(
sigma
=
0.98
sigma
=
0.98
)
2.20
log
(
PGA
)
+
1.00
2.20
log
(
PGA
)
+
1.00
2.20
log
(
PGA
)
+
1.00
2.20
log
(
PGA
)
(
PGA
PGA
)
+
1.00
2.10
log
(
PGV
)
+
3.40
2.10
log
(
PGV
)
+
3.40
2.10
log
(
PGV
)
+
3.40
2.10
log
(
PGV
)
(
PGV
PGV
)
+
3.40
(4)通过比较加州8次重大地震的仪器烈度图(Wald and others,1999),Wald等人发现计算观测的Imm,当Imm < VII时与PGA的对应关系较好,当Imm > VII时PGV与其对应关系较好。在实际使用中,首先使用(4)式前两式进行计算,若4a) PGA计算的Imm大于VII,则使用4b) PGV进行烈度计算;若4a)计算的
mmmmmmmm
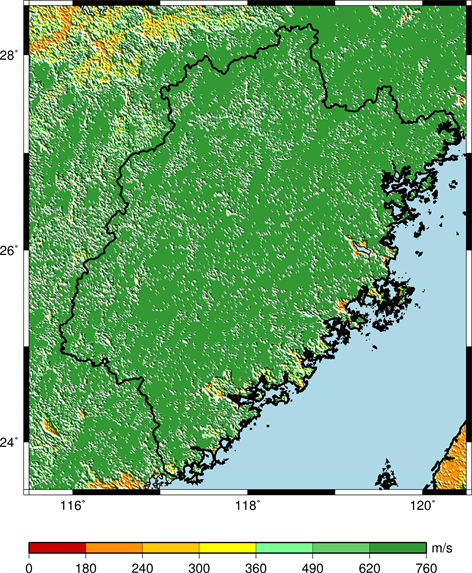
Figure 5. Distribution of Vs30 of Fujian
Figure 5. Distribution of Vs30 of Fujian
图5. 福建地区Vs30分布图
图5Imm在V和VII之间,则对PGA和PGV计算的烈度进行加权 [2] ;ShakeMap系统使用的仪器烈度表如图6所示,根据不同的颜色分段和字体粗细程度来表示所使用的计算公式和仪器烈度大小。
mm图6考虑到仪器烈度计算方法与国内的区别,本文在实际应用中采用了地震仪器烈度表(DB35/T 1308~2012)中的仪器烈度算法 [17] 。地震仪器烈度表如图7所示,计算公式为:
图7
(5)
I
I
=
2.71
×
log
10
(
A
0.5
)
+
2.39
I
I
I
I
=
2.71
×
log
10
log
log
10
10
(
A
0.5
)
(
A
0.5
A
0.5
A
0.5
0.5
)
+
2.39
(5)I为计算的仪器烈度,A0.5为有效峰值加速度,即三分向地震动加速度时程中持续时间大于等于0.5秒的幅值。
0.5由于ShakeMap在实际处理过程中仅使用两水平分量中的最大值,因此本文在对系统进行改造时,使用了上述研究报告中给出的统计的水平分向和A0.5的统计关系式如式(6)和(7)所示。作者根据关系式先将PGA和PGV分别转换成各自对应的有效峰值加速度A0.5,然后再带入(5)式计算仪器烈度。
0.50.5
(6)
log
10
(
PGA
)
=
0.85
×
log
10
(
A
0.5
)
+
0.46
±
0.27
log
10
log
log
10
10
(
PGA
)
(
PGA
PGA
)
=
0.85
×
log
10
log
log
10
10
(
A
0.5
)
(
A
0.5
A
0.5
A
0.5
0.5
)
+
0.46
±
0.27
(6)
(7)
log
10
(
PGV
)
=
1.09
×
log
10
(
A
0.5
)
−
0.81
±
0.16
log
10
log
log
10
10
(
PGV
)
(
PGV
PGV
)
=
1.09
×
log
10
log
log
10
10
(
A
0.5
)
(
A
0.5
A
0.5
A
0.5
0.5
)
−
0.81
±
0.16
(7)在实际应用中,对于M < 6.5级地震,本文采用(5)和(6)计算仪器烈度;对于M > 6.5级,本文采用(5)和(7)式计算仪器烈度。
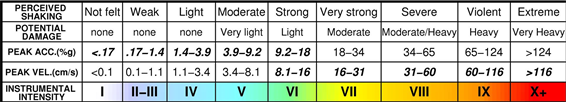
Figure 6. Instrumental Intensity Scale of ShakeMap
Figure 6. Instrumental Intensity Scale of ShakeMap
图6. ShakeMap仪器烈度表
图6Figure 7Figure 7图7. 地震仪器烈度表(DB35/T 1308~2012)
图7最后,由于ShakeMap系统产品内容采用英文表述,不利于国内大众对于地震信息的获取和理解,本文对ShakeMap产出的产品,包括地震动峰值(PGA、PGV等)等值线图、仪器烈度分布图、网页和邮件通知等进行了本地化工作,这对于公众获取地震信息和地震信息的传播起着非常重要的作用。
4. 应用情况
4.1. 实际震例及结果说明
本文对地震动衰减和仪器烈度计算进行修改后,将“改造”后的ShakeMap系统成功编译和运行在测试服务器上。为验证上述改造的可行性以及计算结果的可靠性,作者对2004年以来福建地区4.0级以上地震和台湾地区部分地震进行了处理。本文选取近年来福建地区较大的福建省莆田市仙游县M4.8级地震为例,对初步的应用成果进行展示。仙游地震的三要素信息及改造后的系统处理产品如表3所示。图8~图10分别为此次地震的仪器烈度分布图,本地化的网页显示,本地化的地震邮件通知。
表3图8图10从图7可以看出,震中区仪器烈度石苍乡部分区域为6度,钟山镇、游洋镇等地部分区域为5度,常太镇等地为4度,该处理结果与震后宏观烈度调查结果基本是吻合的 [18] 。另外,ShakeMap系统的本地化工作在保留原有产品信息的同时,使产品更加清晰直观。
图75. 结论与讨论
通过对ShakeMap系统的研究,将前人研究的地震动衰减关系、场地校正和仪器烈度计算等关键算法应用于ShakeMap系统,并实现了ShakeMap产品内容的本地化,完成了ShakeMap系统在福建地区的改造和应用。改造后的地震实例处理结果也较为合理,表明ShakeMap系统在国内地区的改造和应用是可行的。
另外,作者认为还有以下问题亟待解决:
1) 4.0级以上地震动衰减关系,本文采用了康兰池等人对四川地区基岩台站统计的地震动峰值关系以及ShakeMap自带的Hazus衰减关系,由于地震动衰减具有较强的区域性,因此作者认为采用此类衰减关系计算的仪器烈度与真实地震动存在一定的误差。
2) 在计算仪器烈度时,为了和ShakeMap系统保持一致,采用了水平分向PGA, PGV的最大值,利用PGA, PGV和A0.5之间的统计关系进行转换,进而求取仪器烈度,这样的转换可能会对结果造成一定的影响。
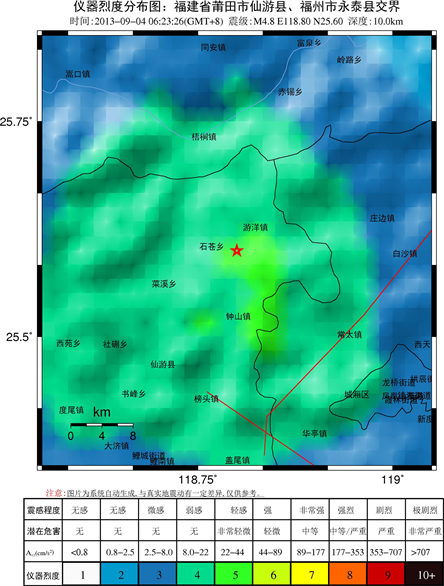
Figure 8. Instrumental intensity map of xianyou earthquake
Figure 8. Instrumental intensity map of xianyou earthquake
图8. 莆田仙游M4.8仪器烈度分布图
图8Figure 9Figure 9图9. 本地化的网页
图9
Table 3. Information of SHUNCHANG Earthquake
Table 3. Information of SHUNCHANG Earthquake
Table 3Table 3表3. 顺昌地震相关信息
表3
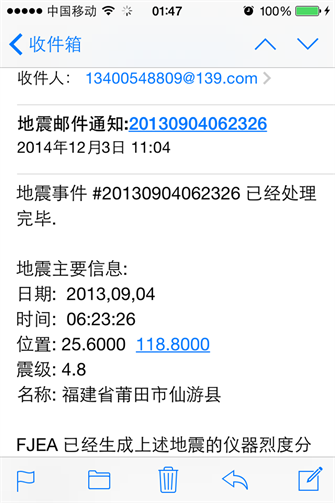
Figure 10. Localization of Earthquake Email Notification
Figure 10. Localization of Earthquake Email Notification
图10. 本地化的地震事件邮件通知
图10致谢
本文得到福建省地震局科技攻关项目(G201405)的资助,感谢福建省地震局监测中心提供数据和技术支持。感谢评审专家的意见和建议,感谢编辑细致的工作,其他对本论文有过帮助的在此也一并表示感谢!
基金项目
福建省地震局科技攻关项目“福建地震预警与烈度速报运维保障系统研究”,编号:G201502。
http://dx.doi.org/10.12677/AG.2017.76076
- 1. Kanamori, H., Hauksson, E. and Heaton, T. (1991) TERRAscope and CUBE Project at Caltech. Eos Transactions American Geo-physical Union, 72, 564-564. https://doi.org/10.1029/90EO00395
- 2. Wald, D.J., Worden, B.C., Quitoriano, V. and Pankow, K.L. (2005) Shake Map Manual: Technical Manual, User’s Guide and Software Guide. U.S. Geological Survey, 132.
- 3. Wald, D.J., Heaton, T., Kanamori, H., Maechling, P. and Quitoriano, V. (1997) Research and Development of TriNet “Shake” Maps. Eos Transactions American Geophysical Union, 78, 45.
- 4. Wessel, P. and Smith, W.H.F. (2013) Generic Mapping Tools: Improved Version Released. Eos Transactions American Geophysical Union, 94, 409-410. https://doi.org/10.1002/2013EO450001
- 5. Wessel, P. and Smith, W.H.F. (1991) Free Software Helps Map and Display Data. Eos Transactions American Geophysical Union, 72, 441-446. https://doi.org/10.1029/90EO00319
- 6. Wessel, P. and Smith, W.H.F. (1995) New Version of the Generic Mapping Tools released. Eos Transactions American Geophysical Union, 76, 329. https://doi.org/10.1029/95EO00198
- 7. Wessel, P. and Smith, W.H.F. (1998) New, Improved Version of the Generic Mapping Tools released. Eos Transactions American Geophysical Union, 79, 579. https://doi.org/10.1029/98EO00426
- 8. Wessel, P. and Smith, W.H.F. (1995) The Generic Mapping Tools (GMT) Version 3.0.
- 9. 金星, 康兰池, 欧益萍. 福建地区中小地震地震动峰值衰减规律研究[J]. 地震学报, 2008, 30(3): 279-291.
- 10. 康兰池. 大震烈度速报系统的应用技术研究[D]: [博士学位论文]. 福州: 福州大学, 2010.
- 11. Boore, D.M., Joyner, W.B. and Fumal, T.E. (1997). Equations for Estimating Horizontal Response Spectra and Peak Accelerations from Western North American Earthquakes: A Summary of Recent Work. Seismological Research Letters, 68, 128-153. https://doi.org/10.1785/gssrl.68.1.128
- 12. Borcherdt, R.D. (1994) Estimates of Site-Dependent Response Spectra for Design (Methodology and Justification). Earthquake Spectra, 10, 617-654. https://doi.org/10.1193/1.1585791
- 13. Allen, T.I., and Wald, D.J. (2007) Topographic Slope as a Proxy for Seismic Site-Conditions (Vs30) and Amplification around the Globe. U.S. Geological Survey Open-File Report, 1357, 69.
- 14. Wald, D.J. and Allen, T.I. (2007) Topographic Slope as a Proxy for Seismic Site Conditions and Amplification. Bulletin of the Seismological Society of America, 97, 1379-1395. https://doi.org/10.1785/0120060267
- 15. Wald, D.J., Quitoriano, V., Heaton, T.H. and Kanamori, H. (1999) Relationship between Peak Ground Acceleration, Peak Ground Velocity, and Modified Mercalli Intensity for Earthquakes in California. Earthquake Spectra, 15, 557-564. https://doi.org/10.1193/1.1586058
- 16. 金星, 张红才, 韦永祥, 等. 基于地震监测台网资料近实时插值计算震动图的初步研究[J]. 防灾减灾学报, 2010, 26(1): 1-11.
- 17. 福建省地方标准. 地震仪器烈度表DB35/T 1308-2012[S].
- 18. 邱泉盛, 陈晓. 仙游永泰交界地震仙游4个村委此次震害VI度区.[EB/OL]. http://news.fznews.com.cn/shehui/2013-9-5/201395MHtSGvMYED225522.shtml, 2013.
1. Kanamori, H., Hauksson, E. and Heaton, T. (1991) TERRAscope and CUBE Project at Caltech. Eos Transactions American Geo-physical Union, 72, 564-564. https://doi.org/10.1029/90EO00395https://doi.org/10.1029/90EO003952. Wald, D.J., Worden, B.C., Quitoriano, V. and Pankow, K.L. (2005) Shake Map Manual: Technical Manual, User’s Guide and Software Guide. U.S. Geological Survey, 132.3. Wald, D.J., Heaton, T., Kanamori, H., Maechling, P. and Quitoriano, V. (1997) Research and Development of TriNet “Shake” Maps. Eos Transactions American Geophysical Union, 78, 45.4. Wessel, P. and Smith, W.H.F. (2013) Generic Mapping Tools: Improved Version Released. Eos Transactions American Geophysical Union, 94, 409-410. https://doi.org/10.1002/2013EO450001https://doi.org/10.1002/2013EO4500015. Wessel, P. and Smith, W.H.F. (1991) Free Software Helps Map and Display Data. Eos Transactions American Geophysical Union, 72, 441-446. https://doi.org/10.1029/90EO00319https://doi.org/10.1029/90EO003196. Wessel, P. and Smith, W.H.F. (1995) New Version of the Generic Mapping Tools released. Eos Transactions American Geophysical Union, 76, 329. https://doi.org/10.1029/95EO00198https://doi.org/10.1029/95EO001987. Wessel, P. and Smith, W.H.F. (1998) New, Improved Version of the Generic Mapping Tools released. Eos Transactions American Geophysical Union, 79, 579. https://doi.org/10.1029/98EO00426https://doi.org/10.1029/98EO004268. Wessel, P. and Smith, W.H.F. (1995) The Generic Mapping Tools (GMT) Version 3.0.9. 金星, 康兰池, 欧益萍. 福建地区中小地震地震动峰值衰减规律研究[J]. 地震学报, 2008, 30(3): 279-291.10. 康兰池. 大震烈度速报系统的应用技术研究[D]: [博士学位论文]. 福州: 福州大学, 2010.11. Boore, D.M., Joyner, W.B. and Fumal, T.E. (1997). Equations for Estimating Horizontal Response Spectra and Peak Accelerations from Western North American Earthquakes: A Summary of Recent Work. Seismological Research Letters, 68, 128-153. https://doi.org/10.1785/gssrl.68.1.128https://doi.org/10.1785/gssrl.68.1.12812. Borcherdt, R.D. (1994) Estimates of Site-Dependent Response Spectra for Design (Methodology and Justification). Earthquake Spectra, 10, 617-654. https://doi.org/10.1193/1.1585791https://doi.org/10.1193/1.158579113. Allen, T.I., and Wald, D.J. (2007) Topographic Slope as a Proxy for Seismic Site-Conditions (Vs30) and Amplification around the Globe. U.S. Geological Survey Open-File Report, 1357, 69.14. Wald, D.J. and Allen, T.I. (2007) Topographic Slope as a Proxy for Seismic Site Conditions and Amplification. Bulletin of the Seismological Society of America, 97, 1379-1395. https://doi.org/10.1785/0120060267https://doi.org/10.1785/012006026715. Wald, D.J., Quitoriano, V., Heaton, T.H. and Kanamori, H. (1999) Relationship between Peak Ground Acceleration, Peak Ground Velocity, and Modified Mercalli Intensity for Earthquakes in California. Earthquake Spectra, 15, 557-564. https://doi.org/10.1193/1.1586058https://doi.org/10.1193/1.158605816. 金星, 张红才, 韦永祥, 等. 基于地震监测台网资料近实时插值计算震动图的初步研究[J]. 防灾减灾学报, 2010, 26(1): 1-11.17. 福建省地方标准. 地震仪器烈度表DB35/T 1308-2012[S].18. 邱泉盛, 陈晓. 仙游永泰交界地震仙游4个村委此次震害VI度区.[EB/OL]. http://news.fznews.com.cn/shehui/2013-9-5/201395MHtSGvMYED225522.shtml, 2013.http://news.fznews.com.cn/shehui/2013-9-5/201395MHtSGvMYED225522.shtml, 2013.