基于改进两参数估计的影响点检测
Influence Points Detection Based on Modified Two-Parameter Estimator
DOI: 10.12677/AAM.2020.911232, PDF, HTML, XML, 下载: 704  浏览: 1,899 
作者: 陈 菊, 李 荣:贵州民族大学数据科学与信息工程学院,贵州 贵阳
关键词: 改进两参数估计数据删除模型近似删除公式Cook统计量影响点Modified Two-Parameter Estimator Data Deletion Model Approximate Deletion FormulaCook Statistics Influence Point
摘要: 在改进两参数估计下对单个数据删除模型进行研究,通过对比删除某个观测值前后估计量的变化程度来度量相应观测值的影响程度,并由近似删除公式得到删除某个数据点前后改进两参数估计量间的关系;同时,在前人的基础上推导得到DFFITS统计量和Cook统计量新的表达形式,并在实例中用两种统计量来识别影响点,验证其合理性。
Abstract: The single data deletion model is studied under the modified two-parameter estimator. The influence degree of the corresponding observation value is measured by comparing the change degree of the estimators before and after deleting a certain observation value, and the relationship between the improved two-parameter estimator value before and after deleting a certain data point is obtained by the approximate deletion formula; at the same time, new expressions of DFFITS statistics and Cook statistics are derived on the basis of predecessors, and two kinds of statistics are used to identify the influence points in an example to verify their rationality.
文章引用:陈菊, 李荣. 基于改进两参数估计的影响点检测[J]. 应用数学进展, 2020, 9(11): 2004-2009. https://doi.org/10.12677/AAM.2020.911232

1. 引言

考虑一般线性回归模型:

y = X β + ε (1)

其中y是 n × 1 的响应变量,X是 n × p 的已知设计矩阵, β p × 1 未知参数向量, ε 是均值为0、协方差矩阵为 σ 2 I n 的n维随机误差向量, I n 表示n阶单位矩阵。

回归诊断中的影响分析主要是研究观测值对回归模型中回归参数估计的影响。对线性模型(1),第i个样本点对参数 β 估计的影响通常是指删除该样本点后模型参数 β 估计的变化情况,若删除该样本点后模型参数 β 估计的变化较大,则认为该样本点对模型参数 β 估计的影响较大。

y ( i ) X ( i ) 分别表示从y和X中删除第i个样本值后的观测向量和设计矩阵,则模型(1)删除第i个样本值后可表示为:

y ( i ) = X ( i ) β + ε (2)

第i个样本点对参数 β 估计的影响分析即对模型(1)和模型(2)所得参数 β 估计变化大小的比较分析。

考虑删除第i个样本点后参数 β 估计变化的总和,Cook和Weisberg [1] 提出了以Cook距离,即

D i = ( β ^ β ^ ( i ) ) ( X X ) ( β ^ β ^ ( i ) ) p s 2 = ( e i 2 p s 2 ) [ h i i ( 1 h i i ) 2 ] (3)

作为第i个样本点对最小二乘估计的影响度量。其中 e i 表示残差 e = y y ^ 的第i个分量, h i i 表示帽子矩阵 H = X ( X X ) 1 X 主对角线上的第i个元素, s 2 = e e / n p σ 2 的估计。

Belsey [2] 等基于删除第i个样本点后响应变量y的预测值变化情况,提出了以DFFITS统计量作为第i个样本点对最小二乘估计的影响度量,即

D F F I T S ( i ) = x i [ β ^ L S β ^ L S ( i ) ] S E ( x i β ^ L S ) = [ e i s ( i ) ] [ h i i 1 / 2 1 h i i ] (4)

其中 β ^ L S = ( X X ) 1 X y β ^ L S ( i ) = ( X ( i ) X ( i ) ) 1 X ( i ) y ( i ) 是分别由模型(1)和模型(2)所得的最小二乘估计。 S E ( x i β ^ L S ) 表示 x i β 标准误差的估计值, s ( i ) 表示模型(2)中 σ 的估计值。

Cook [3] 基于置信椭球提出数据删除法以判断各个数据点对最小二乘估计的贡献。此种方法是通过对比删除某个观测值前后估计量的变化程度来度量相应观测值的影响程度。随后,Chatterjee和Hadi [4] 不断地完善数据删除法,给出了判别异常点,高杠杆点和影响点的若干统计量。

当模型(1)存在复共线性时,最小二乘估计往往表现不稳定,此时再基于最小二乘估计进行影响分析显然不太合适。Belsey [2] 等发现有偏估计下检测到的影响点不同于最小二乘估计下检测到的影响点。Walker和Birch [5] 使用数据删除法检测了岭估计下的影响点,给出近似删除公式。Jahufer和Jianbao [6] 研究了改进岭估计下用于度量影响大小的统计量随岭参数变化的情况。Jahufer [7] 基于Liu估计给出用于度量影响大小的DFFITS和不同形式的Cook距离表达式。Ertas [8] 等给出Liu估计和改进Liu估计的度量影响大小的统计量,并讨论了影响点的识别。Yasin和Murat [9] 研究了两参数岭回归的影响诊断。Adewale和Kayode [10] 通过对比删除某个数据点前后两参数估计的影响程度。

关于参数 β 的估计,考虑存在一个关于 β 的先验信息b,一些学者结合其他有偏估计提出了一系列的改进估计,如Swindel [11] 提出的改进岭估计,Li和Yang [12] 提出的改进Liu估计等。类似的,Adewale [13] 结合先验信息b和两参数估计(Ozkale和Kachiranlar [14] )提出了改进两参数估计(MTPE)

β ^ M T P E = ( X X + k I ) 1 ( ( X X + k d I ) β ^ L S + k ( 1 d ) b ) (5)

其中岭参数 k > 0 ,Liu参数 0 < d < 1

针对线性模型存在复共线性的情形,考虑改进两参数估计可以视为其他许多有偏估计的推广,如当 k = 0 d = 1 时,为最小二乘估计; d = 0 b = 0 时,为岭估计; d = 0 时,为改进岭估计等,本文主要探讨样本点对改进两参数估计的影响。

近似删除公式与检验统计量

根据等式(4),第i个样本点对MTPE的影响度量统计量DFFITS可写为:

D F F I T S ( i ) = x i [ β ^ M T P E β ^ M T P E ( i ) ] S E ( x i β ^ M T P E ) (6)

其中 β ^ M T P E ( i ) 表示模型(2)中未知参数 β 的改进两参数估计,分母是 x i β ^ M T P E 的标准误差估计值。

S E ( x i β ^ M T P E ) = s ( i ) j = 1 n h M T P E i j 2 ,其中 h M T P E i j 是H矩阵的第ij ( h i j )个元素。

由等式(3),Cook统计量可写成如下两个表达式:

D i * = 1 p s [ β ^ M T P E β ^ M T P E ( i ) ] ( X X ) [ β ^ M T P E β ^ M T P E ( i ) ] (7)

D i * * = 1 p s 2 [ β ^ M T P E β ^ M T P E ( i ) ] ( K N 1 X X N 1 K ) [ β ^ M T P E β ^ M T P E ( i ) ] (8)

其中 K = X X + k I N = ( X X + k d I ) + k ( 1 d ) ( X X + k I ) 1 ( X X + k d I ) D i * 是等式(3)的直接推广, D i * * 是基于方差 var ( β ^ M T P E ) = σ 2 [ K 1 N ( X X ) 1 N K 1 ] 给出。 β ^ M T P E β ^ M T P E ( i ) 反映了第i组数据对回归系数 β M T P E 的影响大小且是一个向量,不便比较大小,而MTPE不是比例不变的(X矩阵没有第i行元素),所以设计矩阵X须在计算之前重新缩放。因此,为了 β ^ M T P E β ^ M T P E ( i ) 能够比较大小,可通过近似删除公式实现。

根据模型(2), β ^ M T P E ( i ) 可以写成: β ^ M T P E ( i ) = ( X ( i ) X ( i ) + k I ) 1 [ ( X ( i ) X ( i ) + k d I ) β ^ L S ( i ) + k ( 1 d ) b ] 。利用谢

尔曼–莫里森–伍德伯里(SMW)定理(Rao [15] ), β ^ M T P E ( i ) 可以近似为:

β ^ M T P E ( i ) = ( X X + k I x i x i ) 1 [ ( X X + k d I x i x i ) β ^ L S ( i ) + k ( 1 d ) b ]

式中 K = X X + k I

β ^ M T P E ( i ) = ( K x i x i ) 1 [ ( X X + k d I x i x i ) β ^ L S ( i ) + k ( 1 d ) b ] = ( K 1 + K 1 x i x i K 1 1 x i K 1 x i ) [ ( X X + k d I ) β ^ L S ( i ) x i x i β ^ L S ( i ) + k ( 1 k ) b ] = ˜ β ^ M T P E + K 1 x i 1 m i i [ y ^ M T P E i y i + m i i y i m i i y i ] = ˜ β ^ M T P E e M T P E i K 1 x i 1 m i i (9)

根据等式(9),等式(6)~(8)的近似形式可以写成:

D F F I T S ( i ) = ˜ [ m i i 1 m i i ] e M T P E i S E ( x i β ^ M T P E ) (10)

D i = ˜ [ 1 p s 2 ] [ e M T P E i 1 m i i ] 2 x i ( X X + k I ) 1 ( X X ) ( X X + k I ) x i (11)

D i * * [ 1 p s 2 ] [ e M T P E i 1 m i i ] x i ( X X + k I ) 1 ( X X + k d I ) ( X X ) 1 ( X X + k d I ) ( X X + k I ) 1 x i (12)

其中 m i i = x i K 1 x i

2. 实证分析

案例数据来自文献Longley [16],回归模型(1)给出如下:

y = X β + ε

其中 X = ( x 1 , x 2 , x 3 , x 4 , x 5 , x 6 ) ,y是总派生就业, x 1 是GNP隐含价格平减指数, x 2 是国民生产总值, x 3 是失业率, x 4 是武装力量的规模, x 5 是14岁及以上的非机构人口, x 6 是时间。 X X 的条件数为43,275

(Walker和Birch [5] )。Hoerl和Kennard [17] 提出岭参数的计算方法,并定义为 K = s 2 β ^ 2 max 。在本文中,

k的值计算为5.36488e−08,根据文献(Ullah [18] 等,2013)取 d = 0.9 ,下面通过k和d的值分别计算Cook距离和DFFITS,并通过它们来找出影响点。

Cook [3] 使用数据删除法得到了最小二乘估计下的Cook统计量,将点5、16、4、10和15确定为影响点。Walker和Birch [5] 用基于岭估计的数据删除法发现点16、10、4、15和1是影响点。Jahufer和Jianbao [6] 在前人的基础上使用数据删除法得到了基于修正岭估计下的影响点,分别为16、4、1、10和15五个最有影响的观测值。Ullah [18] 等计算当d值等于0.9时,liu回归中影响点的顺序为16、5、4、10和15。Yasin和Murat [9] 通过基于两参数岭估计的影响点检测确定了观测值16、10、6、1和4为影响点。Adewale和Kayode [10] 通过DFFITS准则确定了强影响点为16、10、4、5和15,通过 D * 检测到的4、10、16、5和1以及 D * * 检测到的16、5、4、15和1分别作为它们的五个最有影响的观测值。

表1显示,所提出的统计量 D F F I T S ( i ) 识别出影响点与其他作者的相同,只是顺序不同。使用 D i D i 检测出的影响点与Cook [3] 和Ullah [18] 等人的相同,只是顺序不同。

应用于Hald数据

实例数据来源于文献Hald [19],包括四个回归变量与十三个观测值,矩阵 X X 的条件数为249.578 (Adewale和Kayode [10] ),条件数表明,该模型具有较强的复共线性。Cook [3]、Yasin和Murat [9] 使用影响统计量检测影响点也用这一数据集。根据文献(Adewale和Kayode [10] ) k和d的值分别为0.0076761和1.18495。Cook [3] 的研究中将观察值8、3、11、6和13按此顺序作为影响点,Yasin和Murat [9] 基于两参数岭估计中利用两种不同形式的Cook距离检测到的影响点分别为8、11、10、3、6和8、11、10、6、13,通过DFFITS检测的最有影响的五个观测值分别是8、11、6、10和13。本文提出的两种形式的Cook距离和DFFITS在实例Hald数据集中计算的结果如表2所示。

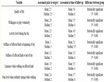
Table 1. The five most influential observed values detected by DFFITS and two versions of Cook distance (Longley)

表1. DFFITS和两个版本的Cook距离检测出的最有影响的五个观察值(Longley)

Table 2. The five most influential observed values detected by DFFITS and two versions of Cook distance (Hald)

表2. DFFITS和两个版本的Cook距离检测的最有影响的五个观察值(Hald)

表2结果显示,本文用 D F F I T S ( i ) D i D i 与Yasin和Murat [9] 用相同的统计量都确定8、11和13是影响点,只是顺序不同。与Cook [3] 研究中使用影响统计量检测出的影响点3、8、11和13相同,顺序不同。

3. 结束语

本文考虑了线性模型存在复共线性时影响点检测的问题。提出利用改进两参数估计进行诊断的新方法。利用SMW定理和改进两参数估计中的近似删除公式,得到了DFFITS和两种不同Cook距离的近似形式。用两个实例说明了这些影响度量统计量的性能。结果表明,所提出的影响度量方法在检测影响点方面与现有的方法有较强的竞争力。这些影响度量方法将会帮助从业者决定是否保留、删除或缩减有影响的数据点时,使用稳健估计在研究中确定。

参考文献

[1] Cook, R.D. and Weisberg, S. (1982) Residuals and Influence in Regression. Chapman and Hall, New York.
[2] Belsley, D.A., Kuh, E. and Welsch, R.E. (1980) Regression Diagnostics: Identifying Influential Data and Sources of Collinearity. Wiley, New York.
https://doi.org/10.1002/0471725153
[3] Cook, R.D. (1977) Detection of Influential Observation in Linear Regression. Technometrics, 19, 15-18.
https://doi.org/10.1080/00401706.1977.10489493
[4] Chatterjee, S. and Hadi, A.S. (1986) Influential Observations, High Leverage Points, and Outliers in Linear Regression. Statistical Science, 1, 379-393.
https://doi.org/10.1214/ss/1177013622
[5] Walker, E. and Birch, J.B. (1988) Influence Measures in Ridge Regression. Technometrics, 30, 221-227.
https://doi.org/10.1080/00401706.1988.10488370
[6] Jahufer, A. and Chen, J.B. (2009) Assessing Global Influential Observations in Modified Ridge Regression. Statistics & Probability Letters, 79, 513-518.
https://doi.org/10.1016/j.spl.2008.09.019
[7] Jahufer, A. (2013) Detecting Global Influential Observations in Liu Regression Model. Open Journal of Statistics, 3, 5-11.
https://doi.org/10.4236/ojs.2013.31002
[8] Ertas, H., Erisoglu, M. and Kaciranlar, S. (2013) Detecting Influential Observations in Liu and Modified Liu Estimators. Journal of Applied Statistics, 40, 1735-1745.
https://doi.org/10.1080/02664763.2013.794203
[9] Yasin, A. and Murat, E. (2016) Influence Diagnostics in Two-Parameter Ridge Regression. Journal of Data Science, 14, 33-52.
[10] Lukman, A.F. and Ayinde, K. (2018) Detecting Influential Observations in Two-Parameter Liu-Ridge Estimator. Journal of Data Science, 16, 207-218.
[11] Swindel, F.F. (1976) Good Ridge Estimators Based on Prior Information. Communications in Statistics—Theory and Methods, 5, 1065-1075.
https://doi.org/10.1080/03610927608827423
[12] Li, Y. and Yang, H. (2012) A New Liu-Type Estimator in Linear Regression Model. Statistical Papers, 53, 427-437.
https://doi.org/10.1007/s00362-010-0349-y
[13] Adewale, F., Lukman, A.F., Ayinde, K., Kun, S.S. and Adewuyi, E.T. (2019) A Modified New Two-Parameter Estimator in a Linear Regression Model. Modelling and Simulation in Engineering, 2019, Article ID: 6342702.
https://doi.org/10.1155/2019/6342702
[14] Ozkale, M.R. and Kaçiranlar, S. (2007) The Restricted and Unrestricted Two-Parameter Estimators. Communications in Statistics—Theory and Methods, 36, 2707-2725.
https://doi.org/10.1080/03610920701386877
[15] Rao, C.R. (1973) Linear Statistical Inference and Its Applications. Biometrics, 31, 791.
https://doi.org/10.2307/2529568
[16] Longley, J.W. (1967) An Appraisal of Least Squares Programs for Electronic Computer from the Point of View of the User. Journal of American Statistical Association, 62, 819-841.
https://doi.org/10.1080/01621459.1967.10500896
[17] Hoerl, A.E. and Kennard, R.W. (1970) Ridge Regression: Biased Estimation for Non-Orthogonal Problems. Technometrics, 12, 55-67.
https://doi.org/10.1080/00401706.1970.10488634
[18] Ullah, M.A., Pasha, G.R. and Aslam, M. (2013) Assessing Influence on the Liu Estimates in Linear Regression Models. Communications in Statistics—Theory and Methods, 42, 3100-3116.
https://doi.org/10.1080/03610926.2011.620206
[19] Jowett, G.H. (1953) Statistical Theory with Engineering Applications. By A. Hald; Statistical Tables and Formulas. By A. Hald. Journal of the Royal Statistical Society, Series A (General), 116, 87-88.
https://doi.org/10.2307/2980953