1. 引言
在变化环境下,由于气候变化和人类活动的影响,流域的产汇流条件发生了明显变化,这就导致流域的洪水序列的一致性遭到破坏,传统基于一致性假设的水文频率计算方法已经不再适用[1] [2] 。针对水文序列的非一致性问题,近些年来国内外水文学者提出一系列的方法[3] -[6] ,其中包括时变矩法,该方法能够直接对非一致水文序列进行频率计算,无需对序列进行还原/还现处理,已经得到广泛应用[7] -[13] 。
由于近几十年来大规模人类活动,如水土保持,城市化建设以及农业灌溉等的影响,渭河流域下垫面条件已经被明显改变,流域的水文过程发生了变化,另一方面在全球变暖的大背景下,渭河流域的降水、气温等气候要素也发生了一定变化[11] [14] ,因此有必要分析洪水序列非一致性对该流域设计洪水过程线的影响。本文以渭河干流华县水文站1951~2011年间的年最大日流量以及年最大3日、5日和7日洪量资料作为研究对象,基于时变矩模型研究了洪水序列的趋势性以及洪水统计参数与前期影响雨量和水土保持面积的相关关系,在变点分析的基础上应用时变矩法进行洪水频率分析,并对比了变点前后渭河相同重现期对应的设计洪水过程线的变化。
2. 研究区域
渭河是黄河最大的支流,发源于甘肃省鸟鼠山,横跨甘肃东部和陕西中部,全长818公里,流域总面积134,766 km2。华县水文站位于渭河干流,控制流域面积为106,498 km2,本文选取的县水文站1951~2011年间最大日流量以及年最大3日、5日和7日洪量(分别定义为 、
、 、
、 和
和 )作为研究对象。
为揭示洪水的影响因素,本文中将研究洪水和一些解释变量之间的相关关系。降水是产生洪水的最根本原因,选取洪水过程发生之前的雨量(即前期影响雨量)作为洪水的解释变量。为了选取与洪水序列相关性最强的前期影响雨量,本文考虑了不同时段的前期影响雨量。对于年最大日流量,选取1、3、5、7、15和30天前期影响雨量作为备选。对于年最大3天洪量,选取3、5、7、15和30天前期影响雨量作为备选。对于年最大5天洪量,选取5、7、15和30天前期影响雨量作为备选。对于年最大7天洪量,选取7、15和30天前期影响雨量作为备选。
近几十年来大规模的人类活动已经明显影响了渭河流域的天然下垫面条件,特别是一系列水土保持工程诸如梯田,植树种草以及坝地建设等显著地改变了流域的产汇流条件,进而影响洪水序列的一致性。本文根据文献[15] 中提供的1959、1969、1979、1989、1996、2000和2006年渭河流域的水土保持面积,假定1951年水土保持面积为0,通过线性插值和外延得到1951~2011年间的年数据,如图1所示,可以发现渭河流域的水土保持面积几乎呈现指数型上升。
3. 研究方法
3.1. 基于时变矩法的洪水频率分析
在我国,一般认为水文序列服从皮尔逊III型分布(简称PIII分布) [16] ,其概率密度函数可以写成如下形式
 (1)
(1)
式中 为位置参数,
 为尺度参数,分别等于序列的均值和离差系数(Cv);
 称为形状参数,其值为序列偏态系数(Cs)的二分之一。
时变矩法通过构造分布参数与某些解释变量的函数关系,进而描述序列统计特征的非一致性[17] 。为保证PIII分布的三个参数都为正,以对数函数作为参数的连接函数,将PIII分布的三个参数分别写成解释变量的函数如下:
 (2)
(2)
其中, 为解释变量;
 为时变矩模型的参数,可以通过极大似然(MLE)进行求解。由于
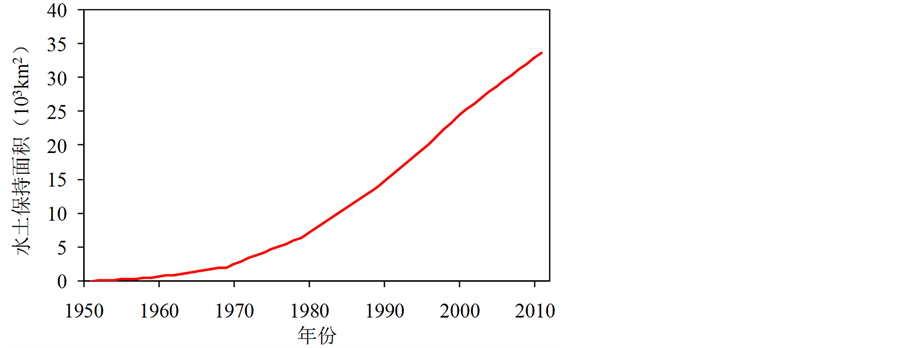
Figure 1. Evolution of water-soil conservation land area in the Weihe River basin
图1. 渭河流域水土保持面积随时间变化
实际中可能并不是所有的统计参数都是时变的,本文根据文献[10] -[13] 中的方法以赤池信息准则[18] (Akaike information criterion; AIC)为优选准则通过穷举法确定时变的参数。最后,模型的拟合优度采用Kolmogorov- Smirnov (KS)检验[19] 进行评价,本文中KS检验的显著性水平取0.05,即KS检验的p-value大于0.05就认为模型的拟合优度较好。
3.2. Pettitt变点检验
作为一种非参数方法,Pettitt方法可以用于诊断服从任何分布时间序列的变点,并且给出变点是否在统计意义上的显著性水平[20] [21] 。对于长度为 的水文时间序列
 ,定义统计量
 如下
如下
 (3)
(3)
式中
 (4)
(4)
最可能的变点 由下式估计
由下式估计
 (5)
(5)
为检验变点 是否显著,统计量
 的显著性水平由如下公式估计
 (6)
(6)
3.3. 设计洪水过程线推求
在我国,设计洪水过程线一般通过放大典型年的洪水过程线推求,目前采用最广泛的是同频率放大和同倍比放大。同频率放大方法推求的设计洪水过程线的峰和不同时段的洪量均分别等于设计值,过程线比较符合设计标准,且计算成果较少受典型年选取的影响。因此本文选取同频率放大方法推求设计洪水过程线,具体步骤见文献[16] 。
4. 结果分析
4.1. 洪水序列趋势性分析
首先以时间t作为解释变量,建立洪水序列 、
、 、
、 和
和 分布参数与时间t的关系,结果如表1和图2中所示。对比模型的AIC准则值可以发现引入时间t作为解释变量后,分布的拟合效果要明显优于常参数的模型。根据序列分布参数与时间的关系可知,四组洪水序列的均值都存在显著的下降趋势,此外最大5日洪量序列
 和最大7日洪量序列
 的离差系数存在增加趋势。
4.2. 洪水序列协变量分析
分别计算出 、
、 、
、 和
和 与不同天数前期影响雨量的相关系数,如表2中所示。从中可以发现最大日流量
 与15天前期影响雨量的相关关系最强,而其他三组洪水序列与30天前期影响雨量相关性最好,并且所有的相关关系都能通过0.05的显著性检验,因此选择这四组与洪水序列相关性最强的前期影响雨量序列分别作为洪水序列的影响因子,如图3中所示。
图4中给出洪水序列 、
、 、
、 和
和 与水土保持面积的关系,从中可以看出洪水序列与水土保持面积有负的指数型相关关系,且相关系数均能通过0.05的显著性检验。
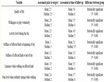
Table 1. Trend analysis for flood series
表1. 洪水序列趋势性分析
注:“+”表示分布参数与时间t存在正的函数关系,“−”表示分布参数与时间t存在负的函数关系;con表示分布参数为常数;P-KS为KS检验的p-value。
Table 2. Pearson’s correlation coefficients between flood and antecedent precipitations
表2. 洪水序列与前期影响雨量之间的皮尔逊相关系数

Figure 3. Correlations between floods and antecedent precipitations
图3. 洪水序列与前期雨量的相关关系
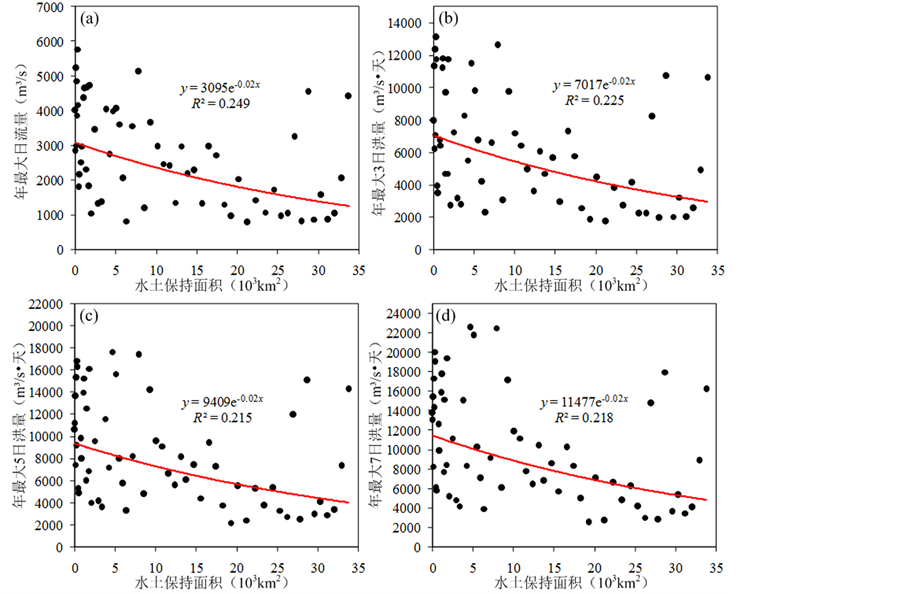
Figure 4. Correlations between floods and water-soil conservation land area
图4. 洪水序列与水土保持面积的相关关系
根据表1中的结果,选择相关性最强的前期影响雨量作为洪水序列的解释变量,建立分布参数与前期影响雨量的函数关系,结果如表3和图5所示。从表3中可以发现PIII分布的位置参数,即序列的均值与前期影响雨量之间存在正的函数关系,模型的AIC准则值要明显小于分布参数为常数的模型。但另一方面,从图5中可以看出九十年代以后实测点据大多落在25%的分位曲线下面,点据的分布不是很合理。
图6中给出了洪水序列对应的前期影响雨量的趋势变化,最大日流量 的前期影响雨量不存在趋势变化,洪水序列
 、
、 和
和 的前期影响雨量虽然存在一定下降趋势,但是远不及相应的洪水序列,这说明单纯以前期雨量作为解释变量并不能完全揭示出洪水序列的趋势变化。在前期影响雨量的基础上,再引入水土保持面积作为洪水序列的解释变量,结果见表3和图7中。从AIC准则看,在加入水土保持面积作为解释变量后,模型的模拟结果比单纯以前期影响雨量为解释变量的模型有了进一步提高,而且实测点据在模型分位图(图7)中的分布较图5中的结果也更加合理,因此洪水序列的下降趋势很可能主要是由于水土保持面积的增加造成的。
4.3. 基于变点分析的设计洪水过程线推求
为了研究洪水序列非一致性变化对渭河设计洪水过程线的影响,下面将基于Pettitt变点检验的结果,用时变矩法对序列进行频率计算,最后对比变点前后设计洪水过程线的变化。
由表4可知,洪水序列 、
、 、
、 和
和 均通过了显著性为0.05的Pettitt变点检验,并且四组序列的变点
Table 3. Covariate analysis for flood series
表3. 洪水序列协变量分析
注:AP表示前期影响雨量,WSC表示水土保持面积;“+”表示分布参数与解释变量存在正的函数关系,“−”表示分布参数与解释变量存在负的函数关系;con表示分布参数为常数;P-KS为KS检验的p-value。
Table 4. Results of Pettitt change-point detection for flood series
表4. 基于Pettitt检验的洪水序列变点分析
Figure 5. Covariate analysis for flood series with the antecedent precipitations introduced as explanatory variable
图5. 前期影响雨量作为解释变量的洪水序列协变量分析
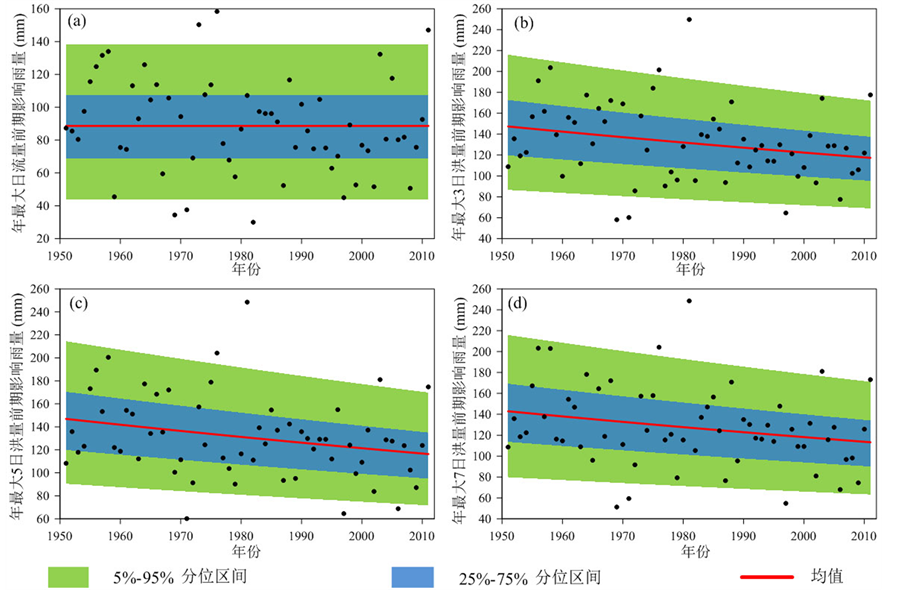
Figure 6. Trend analysis for the antecedent precipitations
图6. 前期影响雨量趋势性分析
都位于1985年。根据Pettitt方法得出的变点,通过时变矩法进一步确定洪水序列的分布参数(表5),结果表明所有序列的均值发生了明显向下的跳跃,如图8中所示。
由于1952年的最大7日洪水过程具有峰高量大主峰靠后的特点,因而选择该年的洪水过程线作为典型设计洪水过程线,应用同频率放大法得到变点前后重现期分别为10、50、100、500和1000年的设计洪水过程线,如图9所示。从图中可见变点之后的洪水过程线要明显低于变点之前相同重现期对应的设计洪水过程线,而且洪水过程线也更加坦化,这表明由于水土保持工程的对洪水过程的调蓄作用,渭河流域的防洪形势变得更加有利。
5. 结论与展望
本文基于时变矩模型研究了渭河流域华县站年最大日流量以及最大3日、5日和7日的洪量的趋势性,建立了洪水序列统计参数同前期影响雨量和水土保持面积的函数关系,结果表明渭河的四组洪水序列都存在显著

Figure 7. Covariate analysis for flood series with both the antecedent precipitations and water-soil conservation land area introduced as explanatory variables
图7. 前期影响雨量和水土保持面积作为解释变量的洪水序列协变量分析
Table 5. Parameter estimation of the flood series based on the results of Pettitt change-point detection
表5. 基于Pettitt变点检验的洪水序列参数估计
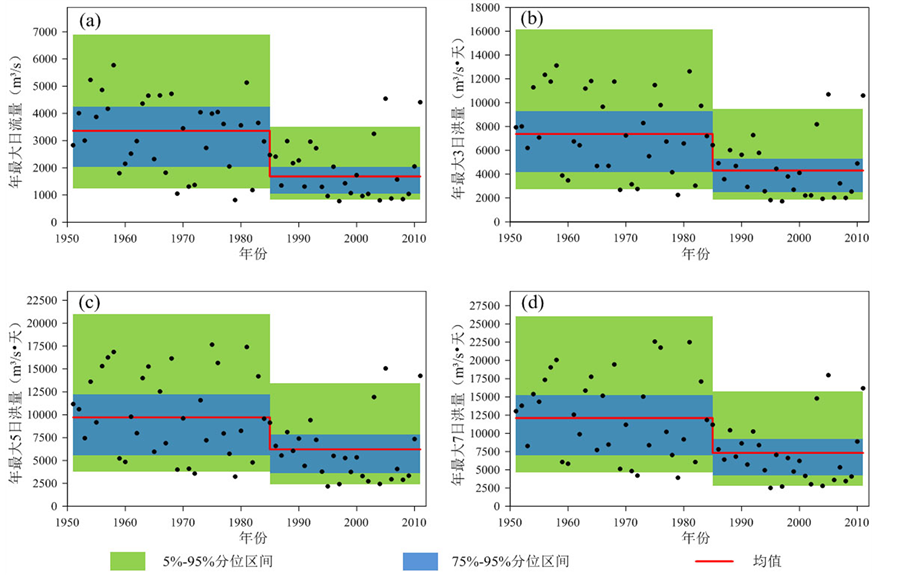
Figure 8. Flood frequency analysis based on the results of change-point detection
图8. 基于变点检验的洪水频率分析
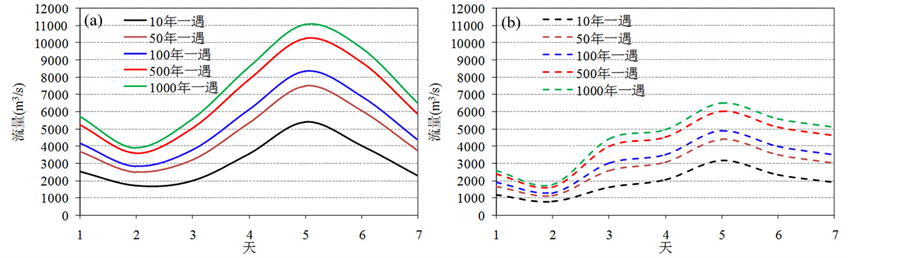
Figure 9. Changes in design flood hydrographs. (a) is the design flood hydrographs before the change-point; (b) is the design flood hydrographs
图9. 变点前后设计洪水过程线变化。(a) 表示变点之前的设计洪水过程线;(b) 表示变点之后的设计洪水过程线
的下降趋势,洪水序列的均值与前期影响雨量存在显著的正相关关系,而与水土保持面积存在显著的负相关关系,水土保持面积的增加是洪水序列下降的主要原因。基于Pettitt变点检验的结果,应用时变矩法推求洪水序列的概率分布,发现所有的洪水序列的均值在1985年发生了明显的突变,相同重现期的设计洪水过程线在变点之后要明显低于变点之前的设计洪水过程线,并且洪水过程线也变得更加坦化。
本文仅仅从统计途径揭示了渭河流域洪水序列非一致性,在今后的研究中有必要从水文过程机制变化角度揭示气候变化和人类活动对渭河洪水序列的影响。
基金项目
国家自然科学基金重大项目(51190094);国家自然科学基金项目(51479139)。