1. 引言
巴丹吉林沙漠以其面积之大、感热输送之强、地理位置之特殊,成为我国西北干旱区与东亚季风系统相互作用的关键环节 [1] [2] [3] [4] 。水资源日趋紧张在沙漠及周边地区表现得尤为突出和严重。沙漠降水作为小概率事件,是表征沙漠气候环境及其响应全球变化的重要指标,更是研究沙漠水环境、水循环的必要依据,对于拥有很多湖泊的巴丹吉林沙漠尤为重要 [5] [6] [7] 。沙漠地区沙尘暴频发,降水对空中沙尘的清洗作用能够改变当地辐射传输、进而影响局地及周围天气、气候 [5] 。
文献 [4] 已分析了巴丹吉林沙漠周边地区降水量的季节、年和年代际变化规律及其空间差异,并指出,位于沙漠西南缘、明显受祁连山影响的区域,其降水变化特征对整个沙漠周边地区有一定的代表性,故本文特选取沙漠西南缘降水作进一步研究,力图搞清该区域:1) 降水的年际和年代际变化规律及其空间差异;2) 降水与东亚季风间可能存在的联系;以及;3) 降水与沙尘暴间的相互影响。分析表明,特别在冬季,降水量 < 1 mm的日数在此区域所占比重较大,故本文将降水量 < 1 mm和 ≥1 mm的降水日分别称为弱降水和较强降水事件,并对之进行了专门分析 [8] 。
2. 选站依据、资料、方法介绍
本文所用资料包括巴丹吉林沙漠西南缘8个常规气象测站在1951~2005年的逐日降水量,8个测站如图1所示;由于缺测,各站资料的起始年份不同,终止年份相同(表1)。研究表明,巴丹吉林沙漠周边降水的空间演变特征主要由海拔高度不同所致,故在文中对海拔影响给以特别关注 [4] ,为此本文搜集了以上测站的海拔高度(图1)。这些资料均由中国气象科学数据共享服务网提供。
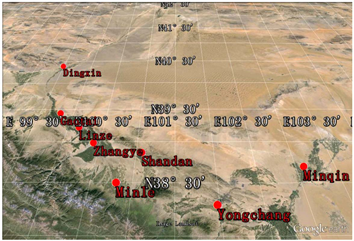
Figure 1. Selected gauge stations over the Badanjaran Desert’s southwestern surrounding area
图1. 巴丹吉林沙漠西南缘所选站点分布
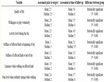
Table 1. Beginning year of the precipitation data series for each selected gauge station
表1. 所选测站降水资料的起始年份
巴丹吉林沙漠西南缘位于东亚季风区域边缘,其降水当受季风,特别是夏季风强弱的影响 [3] 。东亚夏季风的强弱可由夏季风场相对于冬季的变化强度在东亚季风区域的积分(即东亚夏季风指数)来表征 [9] 。本文所用1951~2005年的东亚夏季风指数由中科院大气物理研究所李建平研究员的个人网站慷慨提供。巴丹吉林沙漠是沙尘暴的高发区,其周边气候与沙尘暴之间有着强烈的相互作用 [10] ,为分析降水与沙尘暴间关系所用的1951~2005年的沙尘暴频次序列同样由中国气象科学数据共享服务网提供。
本文在计算降水量、降水频次、降水强度及东亚夏季风指数等的总体变化趋势时,首先利用最小二乘法对各序列进行了线性拟合,然后利用回归方差和剩余方差(即残差)计算出满足F分布的统计量,并据此对拟合结果进行了显著性检验,下文中提及的通过F检验的趋势值即是指相应线性拟合结果通过F检验;对各变量间的相关系数则是用t检验来验证其显著性水平的 [11] - [22] 。
3. 分析和讨论
3.1. 巴丹吉林沙漠西南缘的降水气候
3.1.1. 降水频次及其季节配额的空间差异
沙漠地区降水是小概率事件,尽管一日可能发生数次降水,但日雨量很小 [5] 。以下将各季或全年降水量不小于0.1 mm的日数称为降水频次,降水频次与总日数的比值称为降水频率。各季降水占全年降水频次(降水量)的百分比重为降水频次(降水量)在各季的配额,即降水频次(量)的季节配额。巴丹吉林沙漠西南缘各站降水频次及其配额都是冬季最小,夏季最大,春、秋季相当(图2(a)和图2(b));除民乐夏季配额稍小于50%外,其余各站均超过50%,鼎新超过60%,即该区域夏季降水频次甚至大于其他三季之和,而冬季配额仅有4%~10% [23] [24] [25] 。各季降水频次和频率均随海拔升高而增大 [5] [26] ,平均而言,夏季增幅最大,其次是秋、春季,冬季最小;在最低处鼎新,冬、春、夏、秋季和全年的平均降水频次(率)分别为1.3 (1.4%)、4.5 (4.9%)、16.1 (17.9%)、3.5 (3.9%)、25.4 (7%),而在最高处民乐则分别增为7.8 (8.6%)、15.3 (17.0%)、37.2 (41.3%)、15.2 (16.9%)、75.4 (21%);降水频次的季节配额似不受地形影响。
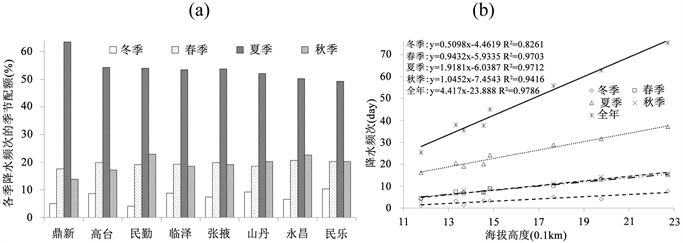
Figure 2. Seasonal rainfall frequency’s percentage among the annual total at each station (a) and its variation with the altitude (b) over the Badanjaran Desert’s southwestern surrounding area (Each point in (b) refers to one station and all stations are arrayed in the same order as in (a))
图2. 巴丹吉林沙漠西南缘各季各站降水频次的季节配额(a)及频次随高度的变化(b) ((b)中各点表示测站,其顺序与(a)一致)
3.1.2. 降水量及其季节配额的空间差异
与频次相似,所有测站的降水量及其季节配额也均以夏季最大,冬季最小,春、秋季相当(图3(b));各站夏季配额均在55%以上,冬季均在5%以下。高地形不仅会使降水增多,还会加大降水量 [5] [26] :各季及全年降水量都随海拔升高而增大,其增幅也是在夏季最大,秋、春季(相当)次之,冬季最小(图3(a));冬、春、夏、秋季鼎新(民乐)的降水量分别为1.9 (10.0)、9.0 (68.5)、34.4 (189.5)、8.4 (69.1) mm。降水量的季节配额也不受地形影响。
3.1.3. 降水强度的季节变化和空间差异
某一时段内的日均降水量和日降水量累积频率分布曲线上95%的分位点均可用以表征该时段降水的总体强度 [27] [28] [29] [30] 。各站降水强度均有明显的季节变化,冬季强度远小于其他三季,除鼎新以秋季最强外,其余测站均以夏季最强,秋季次之,春季第三。除冬季外,各季及全年平均强度均随海拔升高而明显加大(图4(a)和图4(b));夏季增幅最大,秋、春季次之,全年增幅比秋季略大;冬、春、夏、秋季和全年鼎新(民乐)的降水强度分别为0.7 (0.7)、1.8 (3.4)、2.1 (5.1)、2.2 (3.9)、2 (4) mm day−1。
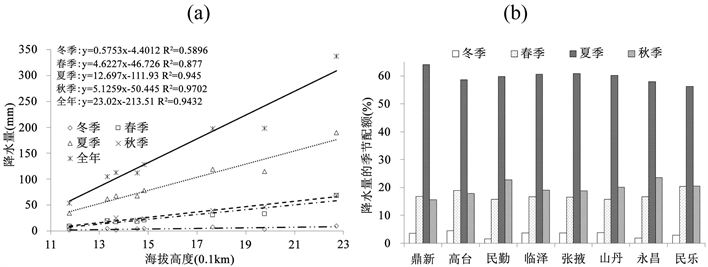
Figure 3. The seasonal precipitation amount’s variation with the altitude (a) (Each point refers to one station, all stations are arrayed in the same order as in (b)) and its percentage among the annual total at each station (b) over the Badanjaran Desert’s southwestern surrounding area
图3. 巴丹吉林沙漠西南缘各季降水量随海拔高度的变化(a) (图中点表示测站,顺序同(b))及其(b)在各站的季节配额
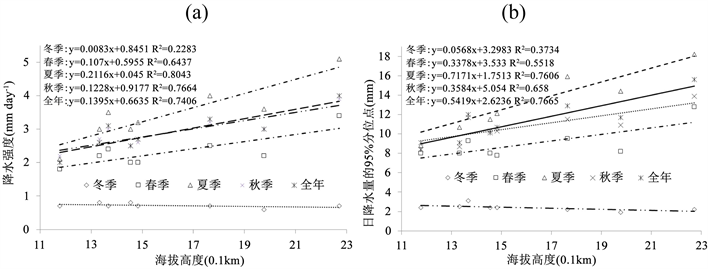
Figure 4. Variations with the altitude of the seasonal or annual mean rainfall intensity (a) and the daily precipitation amount’s 95% percentile; (b) over the Badanjaran Desert’s southwestern surrounding area (Each point refers to one station)
图4. 巴丹吉林沙漠西南缘各季及全年平均降水强度(a)及其日降水量95%分位点;(b) 随海拔高度的变化 (图中点表示测站)
3.1.4. 弱降水及其贡献的季节变化和空间差异
弱降水对于沙漠地带的总雨量而言值得关注:以鼎新为例,在1955~2005年,冬、春、夏、秋四季分别有43.5%、16%、2%和19.1%的年份所有雨日均属于弱降水;51年中四季弱降水对降水量(频次)的贡献分别高达59.4% (79.8%),30.4% (61.1%),12.2% (51.1%),31.6% (64.5%)。
各站弱降水量在冬、春、秋季相当,夏季最大,约为其它各季的2~3倍。各季弱降水量随海拔升高明显增大,冬季增幅最大,其他三季相当(图5(a));鼎新(民乐)冬、春、夏、秋季和全年的弱降水量分别为0.8 (3.6)、1.2 (2.9)、3.1 (4.6)、1.0 (2.7)、5.4 (12.8) mm。弱降水对降水量的贡献冬季最大,夏季最小,春、秋季分别位列第二、第三,全年贡献与夏季基本相同(图5(b));各季及全年贡献都随海拔升高而下降(降幅由大到小排列为春、秋、冬、夏季和全年),说明较高海拔似乎更有利于较强降水的发生。
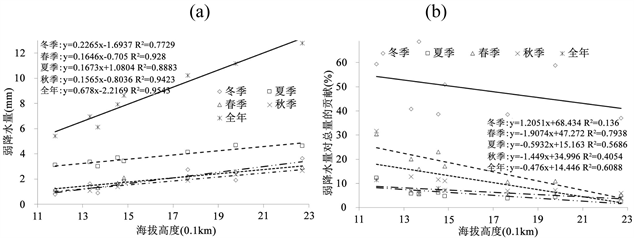
Figure 5. Seasonal or annual precipitation amount due to the weaker rainfall (a) and its contribution to the corresponding total (b) at each station over the Badanjaran Desert’s southwestern surrounding area (Each point refers to one station)
图5. 巴丹吉林沙漠西南缘各站各季及全年的弱降水量(a)及其对总量的贡献(b) (图中点表示测站)
各地弱降水都以夏季最多,春、秋季相当,较高处冬季比春、秋季多,较低处三季相当,夏季弱降水频次是其他三季的1.5~2倍左右;和雨量相似,弱降水频次也随海拔升高而增加,冬季增幅明显大于其余三季(图6(a)):鼎新(民乐)冬、春、夏、秋季及全年的弱降水频次分别为2.5 (10.3)、3.1 (7.1)、8.4 (11.8)、2.8 (6.5)、14.6 (32.6) day。与降水量贡献一致,各地弱降水对总降水频次的贡献也是冬季最大,夏季最小,春、秋季位列第二、第三;值得关注的是,弱降水频次的贡献总是明显大于弱降水量的贡献(图5(b),图6(b));各季及全年弱降水频次的贡献也随海拔升高而下降,冬季降幅最小,春、夏、秋季都是海拔每升高1 km,贡献约下降1.3~1.6个百分点(图6(b));冬、春、夏、秋季和全年鼎新(民乐)弱降水频次的贡献分别为79.8% (71.4%)、61.1% (37.8%)、51.1% (31.3%)、64.5% (39.3%)、54.1% (38.4%)。
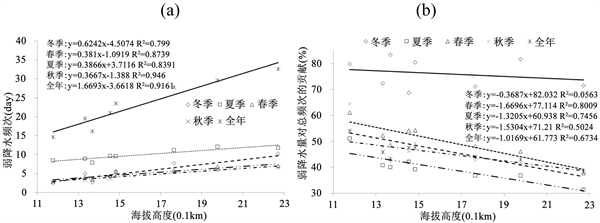
Figure 6. The weaker rainfall’s seasonal or annual frequency (a) and its contribution to the corresponding total (b) at each station over the Badanjaran Desert’s southwestern surrounding area (Each point refers to one station)
图6. 巴丹吉林沙漠西南缘各站各季及全年的弱降水频次(a)及其对总频次的贡献(b) (图中点表示测站)
3.1.5. 较强降水及其贡献的季节变化和空间差异
和总降水量一致,各站全年和四季的较强降水量也以夏季最大,冬季最小,秋、春季分别位居第二、第三;较强降水量也随海拔升高而增大,其增幅与雨量的季节性排序完全一致,全年增幅为海拔每升高1 km约增加22.1 mm (图7(a));冬、春、夏、秋季和全年鼎新(民乐)的较强降水量分别为2.5 (7.1)、8.4 (58.0)、32.3 (189.5)、9.5 (65.6)、47.0 (318.4) mm,民乐约为鼎新的3~7倍左右。各地春、夏、秋和全年较强降水对总雨量的贡献都在85%以上,即使在冬季,也在52%以上(图7(b));贡献的季节排序与雨量完全一致,也是夏季最大,冬季最小,秋、春季分别为第二、第三;春、夏、秋季和全年的贡献均随海拔升高而加大,春季增幅最大(图7(b)),说明在暖季海拔越高的地区越容易发生较强降水。
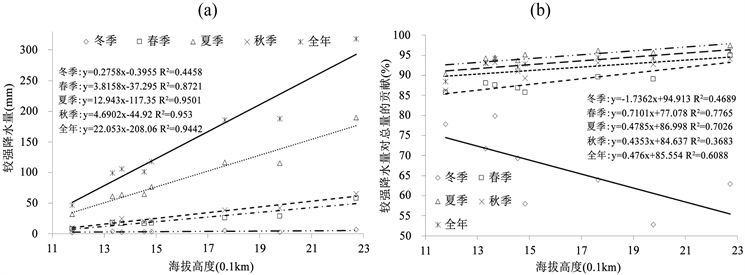
Figure 7. Seasonal or annual precipitation amount due to the heavier rainfall (a) and its contribution to the corresponding total (b) at each station over the Badanjaran Desert’s southwestern surrounding area (Each point refers to one station)
图7. 巴丹吉林沙漠西南缘各站各季或全年较强降水量(a)及其对总量的贡献(b) (图中点表示测站)
各站各季及全年的较强降水频次也以夏季最大,秋、春季次之,冬季最小,夏季频次约为秋、春季的2~3倍,秋、春季又约为冬季的2~4倍(图8(a));较强降水频次也随海拔升高而增加,夏季增幅最大,秋、春季相当,冬季最小,海拔每升高1 km,全年较强降水约增加3.2 day (图8(a));冬、春、夏、秋季和全年鼎新(民乐)的较强降水频次分别为1.2 (4.0)、2.6 (11.0)、8.2 (25.9)、2.2 (10.7)、12.4 (50.5) day,随着海拔增高,降水频次约增加到3~5倍。各季各站较强降水对总频次的贡献大都在50%以上,可见该区域的干湿状况主要取决于较强降水;各站贡献都以夏季为最大,冬季最小,秋、春季分别为第二、第三,这一排序与较强降水的频次、雨量及其对总雨量的贡献完全一致(图7(a)和图7(b),图8(a)和图8(b));除冬季外,较强降水对频次的贡献也随海拔升高而增大,夏季和全年增幅最大;鼎新(民乐)冬、春、夏、秋季和全年较强降水对总频次的贡献分别为46.4% (28.6%)、54.0% (64.4%)、50.3% (68.7%)、53.3% (60.7%)、45.9% (61.6%)。

Figure 8. The heavier rainfall’s seasonal or annual frequency (a) and its contribution to the corresponding total (b) at each station over the Badanjaran Desert’s southwestern surrounding area (Each point refers to one station)
图8. 巴丹吉林沙漠西南缘各站各季或全年较强降水的(a)频次及(b)其对总频次的贡献(图中点表示测站)
值得注意的是,冬季较强降水对总量的贡献随海拔升高而下降(图7(b),图8(b)),这不是计算错误,由于我们更关心有较强(弱)降水的年份内其贡献能达多大,故在计算贡献时未考虑无较强(弱)降水的年份,这就在某种程度上丧失了不同测站间的可比性。然而,各地冬季降水多为弱降水,计算弱降水贡献时各站被剔除的年份很少,所以可借此推出“地形越高,弱降水贡献越小”的一般性结论(图6(b))。
和平均降水强度一样,各站较强降水的平均强度也是夏季最大,冬季最小,秋、春季分别位居第二、第三;春、夏、秋季和全年的较强降水也随海拔升高而明显增强,但冬季却随海拔升高而减弱(图9和图4),看来冬季较强降水的贡献随海拔升高而下降在某种程度上也可归因于较强降水的减弱,其机制是否可以这样猜测:冬季各处均呈低温,雨云不必经地形抬升、降温就能凝成降水,且该季高处一般盛行大风,雨云易被风吹散,终使大雨(雪)变成小雨(雪),小雨(雪)变成无雨(雪),故海拔越高,较强降水反倒越容易被削弱;冬、春、夏、秋季和全年鼎新(民乐)较强降水的平均强度分别为2.1 (1.8)、3.0 (5.6)、4.0 (7.4)、4.1 (6.0)、3.9 (6.4) mm day−1。
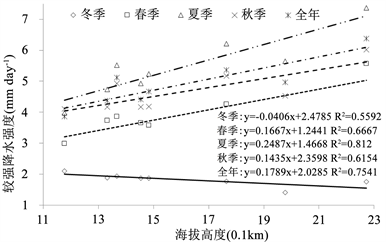
Figure 9. The variation with the altitude of the heavier rainfall’s seasonal or annual mean intensity over the Badanjaran Desert’s southwestern surrounding area
图9. 巴丹吉林沙漠西南缘各季或全年较强降水的平均强度随海拔的变化
3.2. 降水的年际变化趋势及其空间差异
3.2.1. 降水频次及其季节配额的年际变化趋势
1971~2005年间,各地冬、春、秋季及全年降水都呈增多趋势,冬、春季增幅较大(平均每10年约分别增加1~5 day左右),秋季很小,全年增幅约为每10年增加3~9 day左右;各地夏季降水却总体减少,每10年约减少1~2 day;冬、春、秋季及全年的增幅均随海拔升高而明显加大,夏季的减幅却与海拔关系不大(图10(a),表2) [31] [32] 。各地降水频次在冬、春季的配额均呈总体增加趋势,平均增幅为每10年约增加1~5个百分点;秋季配额无明显趋势;夏季配额与频次一致,都有明显的减小趋势,相比冬、春季的增幅,夏季的减幅更大,平均每10年约降低3~9个百分点(表2);降水频次配额的变幅与海拔没有明显关系。
3.2.2. 降水量及其季节配额的年际变化趋势
1971~2005年间,各地冬、春季的降水量都明显增加(图11),冬(春)季增幅为每10年约增加1~4 mm (2~7 mm),春季民乐甚至增加19 mm;夏、秋季降水量没有显著变化趋势;就全年降水量变化趋势而言,只有民乐和永昌两站通过显著性水平为0.1的F统计检验,增幅分别为每10年约增加27、16 mm (表2)。与降水频次的变化趋势一致,冬、春季和全年降水量的变化趋势值都随海拔升高而增大(图10(a)和图10(b)),说明高海拔处具有更为显著的变湿现象。各站降水量的冬、春季配额均明显增大,夏季配额有所减小,秋季配额变化不显著。
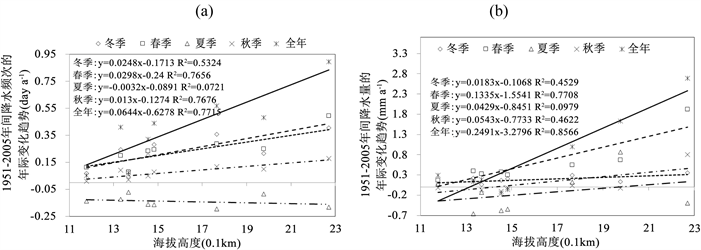
Figure 10. The variations with the altitude of the general inter-annual tendencies during 1971-2005 of the seasonal or annual (a) rainfall frequency (day a−1) and (b) precipitation amount (mm a−1) over the Badanjaran Desert’s southwestern surrounding area
图10. 1971~2005年间沙漠西南缘各季及全年(a)降水频次(day a−1)和(b)降水量(mm a−1)的年际变化趋势随海拔高度的变化
Table 2. The general inter-annual tendencies during 1971-2005 of the seasonal rainfall frequency and its percentage in the annual total and the seasonal precipitation amount and its percentage in the annual total at each station over the Badanjaran Desert’s southwestern surrounding area (Rainfall frequency: day a−1; Precipitation amount:mm a−1; Percentage: % a−1)
表2. 1971~2005年巴丹吉林沙漠西南缘各站降水频次及其季节配额和降水量及其季节配额的年际变化趋势(频次:day a−1;降水量:mm a−1;配额:% a−1)
注:“*”表示趋势值通过显著性水平为0.1的F统计检验。
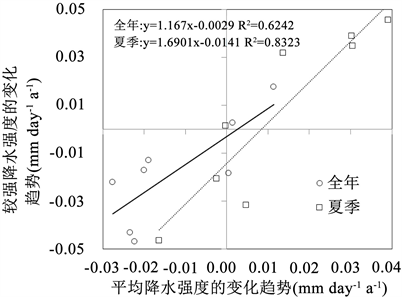
Figure 11. Comparison on the general tendency during 1971-2005 of the heavier rainfall’s mean intensity against that of the average rainfall intensity either in summer or in the whole year over the Badanjaran Desert’s southwestern surrounding area (Each point refers to one station)
图11. 巴丹吉林沙漠西南缘夏季及全年较强降水与所有降水的平均强度在1971~2005年间的变化趋势对比(图中点表示测站)
3.2.3. 降水强度的年际变化趋势
分析表明,各站各季平均和较强降水强度的年际变化幅度均很小,相对而言,夏季和全年的变化趋势较为显著(表略);平均降水强度的变化趋势更取决于较强降水(图11)。
3.2.4. 弱降水的年际变化趋势
1971~2005年间,冬、春季和全年的弱降水量均表现出较为明显的增加趋势,冬、春季(全年)增幅为每10年约增加0.2~1 mm (0.2~1.5 mm)左右;夏季似有所下降,秋季略有增加,但趋势都不显著;冬季和全年的增幅随海拔升高而增大,其余季节则与地形无关(图略)。与雨量一致,冬、春季和全年的弱降水频次也呈较明显的增加趋势,平均每10年冬季约增加1~3 day,春季约增加1~2 day,全年约增加1~4 day;秋季增加不显著,夏季则以平均每10年1 day左右的速率在减少。就地形影响而言,只有冬、夏季和全年的变化趋势值随海拔升高而增大,说明海拔越高,冬季和全年弱降水增多越快,而夏季弱降水减少越快,其余季节似与地形无关(图略)。
3.2.5. 较强降水的年际变化趋势
巴丹吉林沙漠西南缘冬、春季及全年较强降水量在1971~2005年间均明显有所增加,增幅为平均每10年冬季约增加0.5~2.5mm,春季约增加1.3~6.3 mm,全年约增加0.7~8.7 mm,值得关注的是,民乐春季(全年)的增幅高达平均每10年约增加18.8 mm (25.3 mm),永昌全年的增幅高达平均每10年约增加15.7 mm;夏、秋季较强降水量的变化趋势不显著。冬、春、秋和全年较强降水量的变化趋势值均随海拔升高而增大,海拔越高,冬、春季和全年较强降水量增大越快,秋季较强降水量则会由低处的减少趋势变为高处的增大趋势;夏季的变化趋势似与海拔相关不大(图12(a))。
冬、春季和全年较强降水的频次也明显有所增加:各站都是正趋势,且有一半或以上的测站通过显著性水平为0.1的F统计检验,增幅为平均每10年冬、春季增加0.2~1.5 day,全年增加0.1~5.1 day;秋季较强降水也有所增多,夏季却以减少趋势为主,其减幅似与冬季增幅相当。冬、春、秋和全年较强降水频次的变化趋势值均随海拔升高而增大:海拔越高,冬、春、秋季和全年的较强降水增多得越快,夏季的变化趋势与海拔关系不大,可见地形对较强降水的雨量和频次具有一致的影响(图12(a)和图12(b))。

Figure 12. The variations with the altitude of the general tendencies during 1971-2005 of the seasonal or annual precipitation amount (a) due to, and frequency (b) of, the heavier rainfall over the Badanjaran Desert’s southwestern surrounding area
图12. 巴丹吉林沙漠西南缘各季及全年较强降水的(a)雨量和(b)频次在1971~2005年间的变化趋势随海拔高度的变化
3.2.6. 较强及弱降水对变化趋势的贡献
通过分析较强及弱降水与总降水频次及雨量的变化趋势发现:该区域各季及全年降水量的变化趋势基本完全取决于较强降水,只有冬季弱降水对总雨量趋势的贡献约为较强降水的一半以上,其他季节及全年的贡献接近于零(图略);就对频次趋势的贡献而言,春、夏、秋季都是较强降水更大,其中秋季趋势几乎完全取决于较强降水,然而,弱降水的贡献也不可忽视:8个测站中有5个全年弱降水的贡献高于较强降水,7个测站冬季弱降水的贡献约为较强降水的2倍或以上(图略)。
3.3. 降水的年代际变化
1951~2005年,巴丹吉林沙漠西南缘各站降水频次和雨量均呈总体上升的年代际变化趋势(图略);夏、春、秋季降水决定着年总雨量和频次的变化趋势,冬季降水,尤其在雨量趋势上,贡献最小(图略) [33] 。较强及弱降水与总降水频次的变化趋势一致;较强降水对总频次变化趋势的贡献很大,但弱降水的贡献也不小,尤其在冬季。就对总雨量变化趋势的贡献而言,冬季弱降水约为较强降水的一半,其余三季和全年弱降水的贡献可以忽略,即较强降水决定着冬季以外各季总雨量的年代际变化趋势(相关图表略去)。各站降水强度的年代际变化并未表现出明显的一致性(图略),只是所有年代的强度均随海拔升高而加大;夏、秋季降水强度的变化趋势与年均强度最为一致(图略)。
3.4. 降水与东亚夏季风的关系
巴丹吉林沙漠西南缘各季强、弱降水及总降水的雨量、频次及强度与东亚夏季风之间主要存在负相关,冬季更为显著(表3)。春季弱降水与夏季风的负相关似比较强降水和总降水更显著;尽管夏季降水与夏季风指数一样都呈减小或减少趋势,但它们间的负相关却很强,尤以较强降水更为显著,说明夏季风减弱有利于该区域当夏发生较强降水,这应与其处于青藏高原北侧及季风区西缘有关,较弱的夏季风会把其携带的降水系统吹到该区域,而较强的夏季风则更会使其脱离降水系统;秋季夏季风已退到低纬度,对该区域几乎失去影响,因而其相关性也不显著;各站及全区全年的较强及弱降水和总降水与东亚夏季风间的负相关都很显著,说明东亚夏季风越弱,越利于巴丹吉林沙漠西南缘发生不同强度的降水,也即随着夏季风总体减弱,该区域各季及全年的降水均有增加趋势 [34] [35] [36] [37] [38] 。冬季山丹、民乐较强降水的平均强度与夏季风指数间存在显著负相关,但其余各季及全年各站的相关性均未通过显著性水平为0.05或0.1的t统计检验,可见夏季风不会明显影响降水强度(表3)。
Table 3. Correlation coefficients in the inter-annual variation during 1975-2005 of the seasonal or annual precipitation amount due to (a), and frequency of (b), the heavier, weaker and all rainfalls, and the heavier rainfall’s seasonal or annual mean intensity (c) with the East Asian Summer Monsoon Index (EASMI) at each station over the Badanjaran Desert’s southwestern surrounding area
表3. 1975~2005年间巴丹吉林沙漠西南缘各站各季及全年较强、较弱,及总降水的雨量(a)和频次(b),以及较强降水的季及年均强度(c)与东亚夏季风指数年际变化间的相关系数
注:以上表中“**”代表通过显著性水平为0.05的t检验,“*”代表通过显著性水平为0.1的t检验。
3.5. 降水与沙尘暴的关系
由1975~2005年间各站各季及全年较强、较弱和总降水的雨量和频次,以及较强降水强度与当季和下季沙尘暴频次年际变化间的相关系数基本一致为负值 [39] [40] [41] 的事实可知,降水对沙尘暴确以抑制作用为主,降水越多,越不利于当季和下季发生沙尘暴,这种抑制作用尤以冬、春季最为显著。然而,夏季降水与当季和秋季沙尘暴却呈正相关,这应归因于夏季降水和夏、秋季沙尘暴一致减少的变化趋势,这种一致性掩盖了降水的抑制作用;年均降水强度和全年沙尘暴频次也均呈减小趋势,二者间也存在明显的正相关(表4)。
Table 4. Correlation coefficients in the inter-annual variation during 1975-2005 of the seasonal or annual precipitation amount due to, and frequency of, the heavier, weaker and all rainfalls, and the heavier rainfall’s seasonal or annual mean intensity with the dust storm frequency (DSF) in the synchronous or next season over the Badanjaran Desert’s southwestern surrounding area
表4. 1975~2005年巴丹吉林沙漠西南缘各季及全年较强、较弱及总降水的雨量和频次,以及较强降水强度与当季和下季沙尘暴频次年际变化间的相关系数
注:以上表中“**”代表通过显著性水平为0.05的t检验,“*”代表通过显著性水平为0.1的t检验。
4. 结论
本文详细分析了巴丹吉林沙漠西南缘8个常规气象测站降水的季节、年和年代际变化特征及其空间差异,主要得出以下结论:1) 该区域降水主要集中于夏季,冬季最少;各季降水频次、雨量和强度均随海拔升高而增大,夏季增幅最大。2) 各季干湿主要取决于日雨量不小于1 mm的较强降水,但在冬季,日雨量小于1 mm的弱降水也贡献良多。3) 四季较强降水(弱降水)对总降水的贡献随海拔升高而加大(减少),说明海拔越高越易发生较强降水,但冬季除外。4) 就1971~2005年的总体变化而言,冬、春季的较强和弱降水都在显著增加,高处尤甚,秋季增加不明显,夏季则有所减少,全年与冬、春季趋势一致;总降水量的年际和年代际变化趋势取决于较强降水,但就频次而言,弱降水也不能忽视。5) 各季较强及弱降水的雨量和频次与东亚夏季风指数的年际变化间均以负相关为主,随着夏季风的总体减弱,巴丹吉林沙漠西南缘降水有所增加,冬、春季尤为显著。6) 随着冬、春季降水增多,冬、春和夏季沙尘暴明显在减少,反映出降水对沙尘暴的抑制作用;夏季降水与当季和秋季沙尘暴间显著的正相关则表明降水和沙尘暴一致减少的变化趋势掩盖了前者对后者的抑制作用。
致谢
本文由国家自然科学基金项目“巴丹吉林沙漠沙尘暴对大气边界层物质和能量循环的影响及其局地气候效应研究”(41275015)、高原大气与环境四川省重点实验室开放基金资助课题“近期青藏高原热力作用的改变及其对东亚夏季风的影响研究”(PAEKL-2011-C3)、中国气象局成都高原气象研究所高原气象开放实验室基金课题“变暖情况下青藏高原对东亚夏季风热力作用的改变”(LPM2011003)等联合资助,在此深表谢意!
NOTES
*通讯作者。