摘要:
本文选择1981~2019年吐鲁番市高昌区气象局观测站降水量月值资料,对近39年吐鲁番市高昌区降水变化量特征进行分析。结果表明:近39年来吐鲁番市高昌区降水量总体上呈现出略微减少的变化趋势,气候倾向率为−0.689 mm/10a,平均每10年降水量大约减少约0.7 mm;吐鲁番市高昌区降水量年际变化波动起伏非常大,极易发生旱涝灾害,尤其是干旱年份特别多,年降水量不足20 mm的年份有27年,占69.23%。吐鲁番市高昌区一年各个月份均会出现降水天气,特别是5~10月份降水最为集中,该时间段平均降水量是10.9 mm,占年降水量的73.09%;降水最多的月份为6月,月平均降水量为2.9 mm,占年降水量的19.31%,2月降水量最少,月平均降水量仅为0.4 mm,占年平均降水量的2.55%;春季、夏季、秋季、冬季降水量分别占吐鲁番市高昌区年降水量的17.79%、46.31%、23.49%、11.41%;春、冬季两个季节降水量均呈增加变化趋势,冬季增加幅度比春季大;而夏季、秋季降水量均呈减少变化趋势,秋季减少幅度比夏季减少幅度大。
Abstract:
This paper selects the monthly precipitation data from the observation station of Gaochang District Meteorological Bureau of Turpan City from 1981 to 2019 to analyze the characteristics of precipitation changes in Gaochang District of Turpan City in the past 39 years. The results show that in the past 39 years, the precipitation in Gaochang District of Turpan City has shown a slight decreasing trend. The climate tendency rate is −0.689 mm/10a, and the average precipitation is reduced by about 0.7 mm every 10 years; the inter-annual variation of precipitation in Gaochang District, Turpan City fluctuates greatly, and it is very prone to droughts and floods, especially in drought years. There are 27 years when the annual precipitation is less than 20 mm, accounting for 69.23%. In Gaochang District, Turpan City, there will be precipitation weather in every month of the year, especially the most concentrated precipitation from May to October. The average precipitation during this period is 10.9 mm, accounting for 73.09% of the annual precipitation; the most precipitation month is June. The monthly average precipitation is 2.9 mm, accounting for 19.31% of the annual precipitation. February has the least precipitation. The monthly average precipitation is only 0.4 mm, accounting for 2.55% of the annual average precipitation; the precipitation in spring, summer, autumn and winter accounted for 17.79%, 46.31%, 23.49%, and 11.41% of the annual precipitation in Gaochang District, Turpan City, respectively; the precipitations in spring and winter both show an increasing trend, and the increase in winter is larger than that in spring; the precipitations in summer and autumn show a decreasing trend, the decrease in autumn is larger than the decrease in summer.
1. 引言
IPCC第五次评估报告指出,近百年来,地球表面平均温度呈线性上升趋势,升高了0.85℃ [1]。在全球气候变暖趋势加剧的大背景下,各个地区降水量也发生不同程度的变化。为了深入掌握降水气候特征,许多气象学者对地方降水气候展开了一些研究,并取得了一些成效 [2] [3] [4] [5]。吐鲁番市高昌区地处新疆省东部,新疆天山支脉博格达山南麓,吐鲁番盆地的中心,地理坐标:处于88˚29'28''~89˚54'33''E,42˚15'10''~43˚35'N之间。土地总面积13,589平方公里。是吐鲁番市行政中心。高昌区属于典型的大陆性暖温带荒漠气候,整体气候特点:日照充足,热量丰富但又极端干燥,降雨稀少且大风频繁。这里全年日照时数为3000~3200 h左右,比我国东部同纬度地区多1000 h左右,太阳年辐射量139.5~150.4 kcal/cm²,比同纬度的华北、东北地区多15~20 kcal/cm²。由于降水季节分布呈不均匀性态势,所以时常会引发洪涝与干旱灾害,尤其是干旱频发,给当地群众的正常生活时常带来不利影响。因此,本文采取1981~2019年吐鲁番市高昌区近39年的降水量观测资料,分析吐鲁番市高昌区降水变化特征,以期为今后更好地开展防汛抗旱工作,推动高昌区农牧业的健康生产以及社会的和谐稳定发展提供指导。
2. 研究资料与方法
本文所用数据来源于吐鲁番市高昌区气象局,主要为吐鲁番市高昌区1981~2019年的降水量月值观测数据资料。季节的划分采用常规的划分标准:春季表示3~5月、夏季表示6~8月、秋季表示9~11月、冬季表示12月至翌年2月 [1]。本文分析近39年吐鲁番市高昌区降水气候特征及变化采取的方法为常规的线性趋势法数理统计分析法 [2]。
3. 结果与分析
3.1. 吐鲁番市高昌区降水量年际变化特征分析
如图1所示为1981~2019年吐鲁番市高昌区降水量年际变化图,通过该图分析能够了解到,近39年来吐鲁番市高昌区降水量总体上呈现出略微减少的变化趋势,气候倾向率为−0.689 mm/10a,减少幅度并不显著,平均每10年降水量大约减少约0.7 mm。由降水变化趋势图分析还可以发现,近39年平均降水量为14.9 mm,年降水量最多值发生于1998年,为33.4 mm;年降水量最少值发生于2019年,仅为1.9 mm,年降水量最多值是最少值的17.57倍,这充分说明吐鲁番市高昌区降水量年际变化波动起伏非常大,极易发生旱涝灾害,尤其是干旱年份特别多,年降水量不足10 mm的年份有15年,占38.46%,年降水量不足20 mm的年份有27年,占69.23%。

Figure 1. Interannual variation of precipitation in Gaochang District, Turpan City from 1981 to 2019
图1. 1981~2019年吐鲁番市高昌区降水量年际变化图
3.2. 吐鲁番市高昌区降水量月际变化特征分析
统计吐鲁番市高昌区1981~2019年共39年的各月平均降水量资料能够发现,吐鲁番市高昌区一年各个月份均会出现降水天气,特别是5~10月份降水最为集中,该时间段平均降水量是10.9 mm,占年降水量的73.09%。1981~2019年吐鲁番市高昌区降水量月际变化分布图(图2)进行分析还可了解到,吐鲁番市高昌区年内降水呈显著的月际变化,降水最多的月份为6月,月平均降水量为2.9 mm,占年降水量的19.31%;7月、8月降水次之,分别占年降水量的13.61%、13.18%;2月降水量最少,月平均降水量仅为0.4 mm,占年平均降水量的2.55%;2月至6月份吐鲁番市高昌区降水量整体呈增加变化态势,6月份降水量达到最大值,从6月至11月份吐鲁番市高昌区降水量呈递减变化态势。吐鲁番市高昌区年内降水量存在较为显著的干、湿季之分。
3.3. 吐鲁番市高昌区四季降水量变化特征分析
通过1981~2019年吐鲁番市高昌区四季降水量变化特征统计资料能够了解到(表1),近39年来吐鲁番市高昌区春季、夏季、秋季、冬季降水量平均值分别为2.8 mm、6.9 mm、3.5 mm、1.7 mm,分别占吐鲁番市高昌区年降水量的17.79%、46.31%、23.49%、11.41%;春季降水量最多值为20.9 mm,出现年份为1988年,最少值为0.0 mm,出现年份为1982年、1985年、1995年、2011年、2012年、2016年,最大值与最下值之间相差20.9 mm;夏季降水量最多值为17.4 mm,出现年份为2002年、最少值为1.4 mm,

Figure 2. Distribution of monthly changes in precipitation in Gaochang District, Turpan City from 1981 to 2019
图2. 1981~2019年吐鲁番市高昌区降水量月际变化分布图
出现年份为1983年,两者之间相差16.0 mm;秋季降水量最多值为20.6 mm,出现年份为1987年;最少值为0.0 mm,出现年份为1985年、1990年、1992年、1997年、2002年、2004年、2005年、2014年、2016年、2017年、2019年,两者相差20.6 mm;冬季降水量最多值为13.0 mm,出现年份为2012年,最少值0.0 mm,出现年份为1981年、1983年、1990年、1991年、1993年、1994年、1997年、2007年、2009年、2013年、2014年、2017年、2019年,两者之间相差13.0 mm。此外,近39年吐鲁番市高昌区春季、夏季、秋季以及冬季降水量的气候倾向率分别是0.005 mm/10a、−0.426 mm/10a、−0.627 mm/10a以及0.359 mm/10a,这意味着春、冬季两个季节降水量均呈增加变化趋势,冬季增加幅度比较春季大;而夏季、秋季降水量均呈增减少变化趋势,秋季减少幅度比夏季减少幅度大。
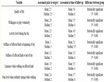
Table 1. Four seasons of precipitation changes in Gaochang District, Turpan City from 1981 to 2019
表1. 1981~2019年吐鲁番市高昌区四季降水量变化特征
4. 结论
1) 近39年来吐鲁番市高昌区降水量总体上呈现出略微减少的变化趋势,气候倾向率为−0.689 mm/10a,平均每10年降水量大约减少约0.7 mm;吐鲁番市高昌区降水量年际变化波动起伏非常大,极易发生旱涝灾害,尤其是干旱年份特别多,年降水量不足20 mm的年份有27年,占69.23%。
2) 吐鲁番市高昌区一年各个月份均会出现降水天气,特别是5~10月份降水最为集中,该时间段平均降水量是10.9 mm,占年降水量的73.09%;降水最多的月份为6月,月平均降水量为2.9 mm,占年降水量的19.31%,2月降水量最少,月平均降水量仅为0.4 mm,占年平均降水量的2.55%。
3) 春季、夏季、秋季、冬季降水量分别占吐鲁番市高昌区年降水量的17.79%、46.31%、23.49%、11.41%;春、冬季两个季节降水量均呈增加变化趋势,冬季增加幅度比春季大;而夏季、秋季降水量均呈减少变化趋势,秋季减少幅度比夏季减少幅度大。