中国广义环境库兹涅茨曲线协整分析
The Cointegration Analysis of the Generalized Environmental Kuznets Curve of China
摘要: 根据1998~2013年中国31个省域人均GDP (Yi,t)和SO2 (EPi,t)排放面板数据,对原始EKC回归方程进行改进,建立变指数γ-EKC回归方程。基于协整分析理论对面板数据进行平稳性检验,Fisher-ADF和PP-Fisher检验结论表明Yi,tYi,tγEPi,t水平序列非平稳,一阶差分序列平稳,即均为一阶单整序列I (1);分别拟合混合估计模型、个体固定效应模型和个体随机效应模型,当γ=3时,个体固定效应模型残差平方和最小,残差序列非平稳,回归方程非协整。本文的研究结论揭示了现有研究中基于原始二次或三次EKC回归方程之所以非协整,并非因为回归方程本身,而在于污染和收入代理变量之间的“虚假回归”关系。
Abstract: Based on the panel data of per capita GDP (Yi,t) and SO2 (EPi,) emissions across 31 provinces of China during the year 1998 and 2013, this paper improves the conventional regression model of EKC and the variational exponential model is established. Testing the stationarity of panel data according to the theory of cointegration analysis, results of Fisher-ADF test and PP-Fisher test show that the level sequences of Yi,t,Yi,tγ and EPi,t are non-stationary, and the first-order differences of them are stationary, which means they are integrated variables with the order of one (I (1)). Using pooled OLS, entity fixed-effect and entity random-effect techniques to fit the model respectively, we find that when γ=3, the sum of squared residuals (SSR) of the entity fixed-effect model is the smallest, but the residual series are non-stationary, and the regression equation does not reflect a cointegrating relationship. Conclusion dressed from this study implies that the failure of cointegration of the conventional EKC regression in EKC literature is not because of the quadratic or cubic functional form itself, but because of the spurious relationship between the indicators of pollutants and income agent.
文章引用:杨洲木, 蔡京京, 曹蔚. 中国广义环境库兹涅茨曲线协整分析[J]. 统计学与应用, 2021, 10(5): 805-815. https://doi.org/10.12677/SA.2021.105083

1. 引言

伴随着能源消耗、全球变暖,环境库茨涅茨曲线(EKC)理论愈发引人关注。EKC理论认为当经济发展到达临界水平之后,环境恶化问题将会缓解。自Grossman和Krueger [1] 首次提出EKC实证研究思想以来,针对经济与环境关系的实证研究纷纷涌现。现有研究中许多学者采用大量不同的环境指标和经济指标研究环境退化与经济发展之间的关系,得出的结论也不尽相同。EKC领域早期研究主要着眼于环境退化代理变量(各种污染物指标)选取,以及人口密度 [2]、地理区域 [3]、制度因素 [4] 等解释性变量的筛选。本世纪早期,EKC研究重点转向于对原始EKC二次和三次回归方程合理性的质疑以及改进。Tenaw和Beyene [5] 采用基于误差校正的面板自回归分布滞后模型研究了1990年到2015年间20个撒哈拉以南非洲国家在面向可持续性的EKC框架内的环境与发展关系,发现二者存在倒“U”型曲线关系。Galeotti等 [6] 建立了多元非线性Weibull方程,应用广义矩估计方法进行参数估计后发现OCED国家的EKC拐点位于人均GDP 16,587美元处。

原始EKC回归方程也面临着计量经济学方面的问题,既然EKC描述的是经济发展进程中的长期现象,在做回归分析之前需要对选取的时间序列数据或面板数据进行平稳性检验,才能进一步判定各变量之间是否存在协整关系。自Granger [7] [8] 和Weiss [9] 提出协整检验思想并由Engle和Granger [10] 做出深入探讨以来,许多学者如Stock [11]、Phillips [12] [13] [14] 以及Johansen [15] [16] [17] 等均对参数和非参数协整检验做出了研究。Phillips [14] [18] [19]、Park [20] [21] [22]、Sims [23] 以及Johansen [24] 等对回归分析协整检验更是作出了原创性的理论构建。Perman和Stern [25] 选取74个国家31年间的人均SO2排放量和GDP数据,应用面板数据单位根检验后发现样本序列非平稳,EKC回归方程并非协整,即原始的SO2-EKC模型存在虚假回归问题。Esteve和Tamarit [26] 应用非线性阈值协整检验方法研究了西班牙人均CO2排放量和人均GDP之间的关系,指出西班牙EKC关系是协整的。Jiang [27] 等人指出中国CO2排放量与电力消费和生产等因素存在EKC型协整关系。Cheikh [28] 等采用面板平滑过渡回归模型研究了1980年到2015年间12个中东和北非国家人均CO2排放量、人均能源消耗和人均GDP之间的关系,结果表明:人均能源消耗对人均CO2排放的影响呈现倒“U”型模式,只有在能源消耗增长较高的情况下,人均GDP增长才会对人均CO2排放有显著影响。Tiwari [29] 和Kanjilal [30] 均证明了印度的能源消耗、经济增长、对外贸易与碳排放量之间存在长期协整关系。Shahbaz [31] 等研究发现巴基斯坦的CO2排放量、能源消耗与经济增长之间存在协整关系,并且指出经济增长与CO2排放之间存在单向因果关系。Wang [32] 选取OECD国家1870~2001年间的面板数据,研究认为原始的EKC二次回归方程非协整,原因并非在于模型本身,而是因为污染和收入水平之间存在伪回归关系。

本文对EKC研究领域的主要贡献如下:首先,基于Perman和Stern [25] 以及Wang [32] 的研究基础,拓展并建立了广义变指数EKC回归方程,即 γ -EKC模型。其次,基于协整分析理论,在各变量序列均为同阶单整的前提下,分别拟合混合估计模型、个体固定效应模型以及个体随机效应模型,F检验和Hausman检验表明当 γ ( 2 , 3 ] 时个体效应模型拟合效果最优;当 γ = 3 时,残差平方和最小,残差序列非平稳,回归方程非协整。本文的研究结论初步表明,中国EKC现有研究中基于原始二次或三次EKC回归方程之所以非协整,并非因为回归方程本身,而在于污染和收入水平之间的“虚假回归”关系。

2. 数据来源

文中数据来源于《中国统计年鉴》、《新中国六十年统计资料汇编》以及《中国能源统计年鉴》(注:1998到2003年SO2排放量统计数据缺失,由笔者依据中国统计年鉴中工业排放和生活排放汇总得到)。文中所用分地区人均国内生产总值以1998年作为基期按GDP平减指数平减。根据《中国统计年鉴》的划分,文中待分析的区域包括东部地带、中部地带、西部地带,涵盖31个省域,限于篇幅,数据可联系作者索取。数据散点图如图1~3所示。
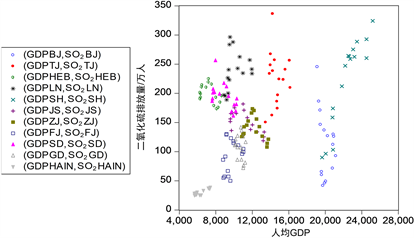
Figure 1. Per capita GDP in the eastern region (yuan/person)-SO2 (ton/10,000 people)

图1. 东部地带人均GDP (元/人)-SO2 (吨/万人)散点图
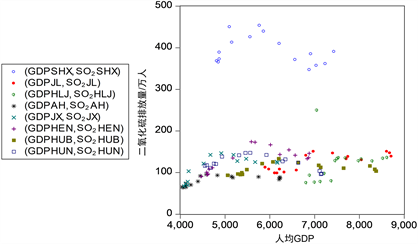
Figure 2. Per capita GDP in the central region (yuan/person)-SO2 (ton/10,000 people)

图2. 中部地带人均GDP (元/人)-SO2 (吨/万人)散点图
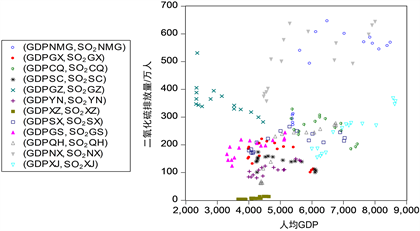
Figure 3. Per capita GDP in the western region (yuan/person)-SO2 (ton/10,000 people)

图3. 西部地带人均GDP (元/人)-SO2 (吨/万人)散点图

3. γ-EKC模型及相关检验

3.1. γ-EKC模型

基于Perman和Stern [25] 以及Yi-Chia Wang [32] 的研究基础,本文拓展建立了广义变指数EKC回归方程,即 γ -EKC模型。

模型I:

E P i , t = α i + β 1 Y i , t + β 2 Y i , t 2 + β 3 Y i , t γ + β 4 Z i , t + ε i , t , i = 1 , 2 , , N ; t = 1 , 2 , , T (1)

其中, α i β j ( j = 1 , 2 , 3 , 4 ) 为回归系数, E P i , t Y i , t 分别表示第i个地区在t时期的环境指标(每万人SO2排放量)和经济指标(人均GDP), Z i , t 表示其他解释变量,参数 γ ( 2 , 3 ] ε i , t 表示误差项。

3.2. 面板单位根检验

按照协整理论,为规避虚假回归,在对回归方程进行参数估计和显著性检验之前需对各变量序列进行平稳性检验,当解释变量序列与被解释变量序列单整阶数相同时才能进一步做协整检验 [33] [34]。表1表2分别给出了 Y i , t Y i , t 2 以及 E P i , t 水平序列和一阶差分序列的ADF-Fisher和PP-Fisher面板单位根检验结果。可见, Y i , t Y i , t 2 以及 E P i , t 序列需要经过一阶差分后才会变为平稳序列,即均为一阶单整序列(记为I (1))。

Table 1. EKC variable panel ADF-Fisher unit root test

表1. EKC变量面板ADF-Fisher单位根检验

Table 2. EKC variable panel PP-Fisher unit root test

表2. EKC变量面板PP-Fisher单位根检验

接下来,本文对 Y i , t γ ( γ ( 2 , 3 ] γ 以0.1为步长)进行单位根检验。表3给出了不同 γ 下的 Y i , t γ 及其一阶差分后的单位根检验结果,可以看出,当 γ ( 2 , 3 ] 时,一阶差分后的 Y i , t γ 是平稳的,即 Y i , t γ 均为 I ( 1 ) 。综上所述,当 γ ( 2 , 3 ] 时, Y i , t Y i , t 2 Y i , t γ E P i , t 均是 I ( 1 ) ,即为一阶单整序列。因此,文中建立的广义变指数EKC回归方程可能是协整方程。

Table 3. Unit root test of Y i , t γ and Δ Y i , t γ

表3. Y i , t γ Δ Y i , t γ 的单位根检验

4. 模型估计与检验

4.1. 模型估计

4.1.1. 混合估计模型

基于 γ -EKC模型,本文建立混合估计模型,即模型II。

模型II:

{ E P i , t = α + β 1 Y i , t + β 2 Y i , t 2 + β 3 Y i , t γ + ε i , t C o v ( Y i t , ε i t ) 0 (2)

其中 i = 1 , 2 , , 31 分别表示我国31个省域, t = 1998 , 1999 , , 2013 表示年份(下文同),模型估计结果如表4所示。

Table 4. Estimation results of mixed estimation model under different γ

表4. 不同 γ 下混合估计模型估计结果

4.1.2. 个体固定效应模型

基于 γ -EKC模型,本文建立个体固定效应模型,即模型III。

模型III:

{ E P i , t = C + i = 1 31 α i e i + β 1 Y i , t + β 2 Y i , t 2 + β 3 Y i , t γ + ε i , t E ( ε i t | α i , Y i t ) = 0 (3)

其中 e i 服从(0-1)分布。模型估计结果如表5所示。

4.1.3. 个体随机效应模型

基于 γ -EKC模型,本文建立个体随机效应模型,即模型IV。

模型IV:

{ E P i , t = C + i = 1 31 α i e i + β 1 Y i , t + β 2 Y i , t 2 + β 3 Y i , t γ + ε i , t E ( α i | Y i t ) = α (4)

其中 e i 服从(0-1)分布。模型估计结果如表6所示。

Table 5. Individual fixed-effect model estimation results under different γ

表5. 不同 γ 下个体固定效应模型估计结果

Table 6. Individual random effects model estimation results under different γ

表6. 不同 γ 下个体随机效应模型估计结果

由模型估计结果表4~6可以看出, γ ( 2 , 3 ] 时,混合估计模型和个体随机效应模型拟合优度均较差,个体固定效应模型拟合优度较好。

4.2. 模型检验

4.2.1. 回归残差平方和

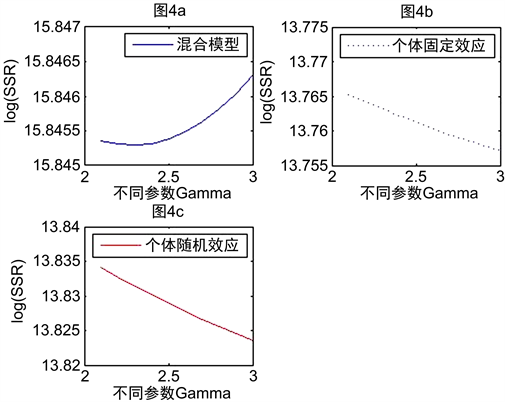
由于残差平方和反映了被解释变量观测值与估计值之间的总变差,因此残差平方和的最小值可以作为如何选择模型中的 γ 、进而来估计非线性GDP-SO2关系的准则。由图4可以看出,相比于其他两种模型,当 γ ( 2 , 3 ] (步长为0.1)时,个体固定效应模型相应的残差平方和均为最小;针对个体固定效应模型而言,当 γ = 3 时,回归残差平方和最小,拟合优度最高。

Figure 4. The sum of squares of the log residuals corresponding to the least square estimation under different γ

图4. 不同参数 γ 下最小二乘估计相应的对数残差平方和

4.2.2. LR、F及Hausman检验

LR检验可用来判别面板数据模型中参数约束是否成立,F检验可用来判别真实模型为混合模型还是个体固定效应模型,而Hausman检验可用来判别真实模型为个体随机效应模型还是个体固定效应模型 [35]。当参数 γ = 3 时,相关检验结果如表7所示:

Table 7. LR and F test results

表7. LR及F检验结果

结论是参数约束成立,应该建立个体固定效应模型。

4.3. 个体固定效应模型协整检验

传统的对于时间序列协整的定义是指若两个或多个非平稳的变量序列,其某个线性组合序列呈平稳性,协整的要求或前提是同阶单整。Pedroni [33] 将协整检验延伸至环境面板数据中,通过对回归方程的残差序列的单位根检验,检验残差序列的平稳性,进而可以判断所建立的回归方程是否为协整方程。由上文分析,当 γ ( 2 , 3 ] 时, Y i , t Y i , t 2 Y i , t γ E P i , t 均为一阶单整序列,因此本文建立的 γ -EKC模型中的解释变量与被解释变量之间可能存在长期协整关系。结合4.2模型检验结果,下文对 γ = 3 时个体固定效应模型进行协整检验,表8为回归残差单位根检验结果。由表8可见,残差序列非平稳,所建立的个体固定效应模型非协整。

Table 8. Unit root test of residual series

表8. 残差序列单位根检验

5. 主要贡献及展望

本文对EKC领域研究的主要贡献如下:

1) 首先基于Perman和Stern [25] 以及Yi-Chia Wang [32] 的研究基础,拓展并建立了广义变指数 γ -EKC模型。对1998~2013年间中国31个省域人均GDP与SO2排放量数据进行面板单位根检验,结果显示人均GDP ( Y i , t )、 Y i , t 2 Y i , t γ 以及每万人SO2排放量( E P i , t )均为一阶单整序列( I ( 1 ) )。

2) 基于 γ -EKC模型,分别拟合了混合估计模型、个体固定效应模型及个体随机效应模型,发现 γ = 3 时,个体固定效应模型回归残差平方和最小,拟合优度最高。

3) γ = 3 时,个体固定效应模型相应的残差序列非平稳,回归方程非协整。本文的研究结论表明,现有研究中基于原始二次或三次EKC回归方程之所以非协整,并非因为回归方程本身,而在于污染和收入水平之间的“虚假回归”关系。

本文的研究不足可能有如下两方面:

1) 局限于统计数据的可靠性以及数据缺失等原因,本文选择SO2排放量作为环境退化代理变量。若采用其他空气质量指标(SO2、SPM、NO2、Lead、CO、VOC和CO2)数据、水质指标(病原体、重金属、水质机制)数据或各种环境指标如安全饮用水数据、市政固体废弃物排放数据、森林砍伐率数据等 [36],能否得到相同结论还有待进一步研究。选用不同的环境退化代理变量甚至会导致研究结论大相径庭 [36],为规避不同环境退化代理变量不可公度化问题,未来的研究可考虑通过建立环境退化损失函数,进而货币化衡量环境污染损失。

2) 本文没有考虑其他解释变量 Z i , t E P i , t 的影响,下一步的研究可借助于VAR模型、SVAR模型以及VECM模型加以拓展。

基金项目

本文的研究得到了“2020江苏高校‘大学素质教育与数字化课程建设’专项课题”(项目编号:2020JDKT032)以及“2021江苏省大学生创新创业训练计划省级一般项目‘基于I-O和多目标规划模型的江苏省碳达峰路径模拟’”(项目编号:202110300099Y)的资助,特此致谢!。

参考文献

[1] Grossman, G.M. and Krueger, A.B. (1991) Environmental Impacts of a North American Free Trade Agreement. Working Paper No. 3914, National Bureau of Economic Research, Cambridge.
https://doi.org/10.3386/w3914
[2] Panayotou, T. (1997) Demystifying the Environmental Kuznets Curve: Turning a Black Box into a Policy Tool. Environment and Development Economics, 2, 465-484.
https://doi.org/10.1017/S1355770X97000259
[3] Torras, M. and Boyce, J.K. (1998) Income, Inequality, and Pollution: A Reassessment of the Environmental Kuznets Curve. Ecological Economics, 25, 147-160.
https://doi.org/10.1016/S0921-8009(97)00177-8
[4] Shafik, N. and Bandyopadhyay, S. (1998) Economic Growth and Environmental Quality: Time Series and Cross-Country Evidence. Background Papers No. 904, World Bank, Washington DC.
[5] Tenaw, D. and Beyene, A.D. (2021) Environmental Sustainability and Economic Development in Sub-Saharan Africa: A Modified EKC Hypothesis. Renewable and Sustainable Energy Reviews, 143, Article ID: 110897.
https://doi.org/10.1016/j.rser.2021.110897
[6] Galeotti, M., Lanza, A. and Pauli, F. (2006) Reassessing the Environmental Kuznets Curve for CO2 Emissions: A Robustness Exercise. Ecological Economics, 57, 152-163.
https://doi.org/10.1016/j.ecolecon.2005.03.031
[7] Granger, C.W.J. (1981) Some Properties of Time Series Data and Their Use in Econometric Model Specification. Journal of Econometrics, 16, 121-130.
https://doi.org/10.1016/0304-4076(81)90079-8
[8] Granger, C.W.J. (1983) Cointegrated Variable and Error Correction Models. Discussion Paper No. 83-13a, University of California, San Diego.
[9] Granger, C.W.J. and Weiss, A.A. (1983) Time Series Analysis of Error-Correcting Models. In: Karlin, S., Amemiya, T. and Goodman, L.A., Eds., Studies in Econometrics, Time Series and Multivariate Statistics, Academic Press, New York, 255-278.
https://doi.org/10.1016/B978-0-12-398750-1.50018-8
[10] Engle, R.F. and Granger, C.W.J. (1987) Co-Integration and Error Correction: Representation, Estimation and Testing. Econometrica, 55, 251-276.
https://doi.org/10.2307/1913236
[11] Stock, J.H. (1987) Asymptotic Properties of Least Squares Estimates of Cointegration Vectors. Journal of the American Statistical Association, 83, 1097-1107.
https://doi.org/10.1080/01621459.1988.10478707
[12] Phillips, P.C.B. and Quliaris, S. (1988) Testing for Cointegration Using Principal Components Methods. Journal of Economic Dynamics and Control, 12, 205-230.
https://doi.org/10.1016/0165-1889(88)90040-1
[13] Phillips, P.C.B. (1988) Spectral Regression for Cointegrated Time Series. No.872, Cowls Foundation, ‎New Haven.
[14] Phillips, P.C.B. (1991) Optimal Inference in Cointegrated Systems. Econometrica, 59, 283-306.
https://doi.org/10.2307/2938258
[15] Johansen, S. (1988) Statistical Analysis of Cointegration Vectors. Journal of Economic Dynamics and Control, 12, 231-254.
https://doi.org/10.1016/0165-1889(88)90041-3
[16] Johansen, S. and Juselius, K. (1990) Maximum Likelihood Estimation and Inference on Cointegration—With Application to the Demand for Money. Oxford Bulletin of Economics and Statistics, 52, 169-210.
https://doi.org/10.1111/j.1468-0084.1990.mp52002003.x
[17] Johansen, S. and Juselius, K. (1990) Some Structural Hypotheses in a Multivariate Cointegration Analysis of the Purchasing Power Parity and the Uncovered Interest Parity for UK. University of Copenhagen, Copenhagen, No. 90-05.
[18] Phillips, P.C.B. and Park, Y.J. (1988) Asymptotic Equivalence of OLS and GLS in Regression with Integrated Regressors. Journal of the American Statistical Association, 83, 111-115.
https://doi.org/10.1080/01621459.1988.10478573
[19] Phillips, P.C.B. and Hansen, B.E. (1990) Statistical Inference with I(1) Processes. Review of Economic Studies, 57, 99-125.
https://doi.org/10.2307/2297545
[20] Park, Y.J. and Phillips, P.C.B. (1988) Statistical Inference in Regressions with Integrated Processes: Part 1. Econometric Theory, 4, 468-497.
https://doi.org/10.1017/S0266466600013402
[21] Park, Y.J. and Phillips, P.C.B. (1989) Statistical Inference in Regressions with Integrated Processes: Part 2. Econometric Theory, 5, 95-131.
https://doi.org/10.1017/S0266466600012287
[22] Park, Y.J. (1988) Canonical Cointegrating Regressions. CAE Working Paper No. 88-29, Cornell University, Ithaca.
[23] Sims, C.A., Stock, J.H. and Watson, M.W. (1990) Inference in Linear Time Series Models with Some Unit Roots. Econometrica, 58, 113-144.
https://doi.org/10.2307/2938337
[24] Johansen, S. (1991) Estimation and Hypothesis Testing of Cointegration Vectors in Gaussian Vector Autoregressive Models. Econometrica, 59, 1551-1580.
https://doi.org/10.2307/2938278
[25] Perman, R. and Stern, D.I. (2003) Evidence from Panel Unit Root and Cointegration Tests that the Environmental Kuznets Curve Does Not Exist. Australian Journal of Agricultural and Resource Economics, 47, 325-347.
https://doi.org/10.1111/1467-8489.00216
[26] Esteve, V. and Tamarit, C. (2012) Threshold Cointegration and Nonlinear Adjustment between CO2 and Income: The Environmental Kuznets Curve in Spain, 1857-2007. Energy Economics, 34, 2148-2156.
https://doi.org/10.1016/j.eneco.2012.03.001
[27] Jiang, Q., Khattak, S.I. and Rahman, Z.U. (2021) Measuring the Simultaneous Effects of Electricity Consumption and Production on Carbon Dioxide Emissions (CO2e) in China: New Evidence from an EKC-Based Assessment. Energy, 229, Article ID: 120616.
https://doi.org/10.1016/j.energy.2021.120616
[28] Ben Cheikh, N., Ben Zaied, Y. and Chevallier, J. (2021) On the Nonlinear Relationship between Energy Use and CO2 Emissions within an EKC Framework: Evidence from Panel Smooth Transition Regression in the MENA Region. Research in International Business and Finance, 55, Article ID: 101331.
https://doi.org/10.1016/j.ribaf.2020.101331
[29] Tiwari, A.K., Shahbaz, M. and Hye, O.M.A. (2013) The Environmental Kuznets Curve and the Role of Coal Consumption in India: Cointegration and Causality Analysis in an Open Economy. Renewable and Sustainable Energy Reviews, 18, 519-527.
https://doi.org/10.1016/j.rser.2012.10.031
[30] Kanjilal, K. and Ghosh, S. (2013) Environmental Kuznet’s Curve for India: Evidence from Tests for Cointegration with Unknown Structural Breaks. Energy Policy, 56, 509-515.
https://doi.org/10.1016/j.enpol.2013.01.015
[31] Shahbaz, M., Lean, H.H. and Shabbir, M.S. (2012) Environmental Kuznets Curve Hypothesis in Pakistan: Cointegration and Granger Causality. Renewable and Sustainable Energy Reviews, 16, 2947-2953.
https://doi.org/10.1016/j.rser.2012.02.015
[32] Wang, Y.-C. (2013) Functional Sensitivity of Testing the Environmental Kuznets Curve Hypothesis. Resource and Energy Economics, 35, 451-466.
https://doi.org/10.1016/j.reseneeco.2013.01.003
[33] Pedroni, P. (1999) Critical Values for Cointegration Tests in Heterogeneous Panels with Multiple Regressors. Oxford Bulletin of Economics and Statistics, 61, 653-670.
[34] 威廉·H·格林. 计量经济分析[M]. 北京: 中国人民大学出版社, 2011.
[35] 张晓峒. EViews使用指南与案例[M]. 北京: 机械工业出版社, 2007.
[36] Dinda, S. (2004) Environmental Kuznets Curve Hypothesis: A Survey. Ecological Economics, 49, 431-455.
https://doi.org/10.1016/j.ecolecon.2004.02.011