摘要: 目的:通过频域OCT (spectral-domain optic coherence tomography, SD-OCT)的测量,比较早、中、晚期原发性闭角型青光眼(primary angle-closure glaucoma, PACG)中黄斑神经节细胞层(ganglion cell layer, GCIPL)厚度、视网膜神经纤维层(retinal nerve fiber layer, RNFL)厚度和视盘相关参数(ONH parameters)的差异。方法:回顾性研究了36例PACG眼的SD-OCT的检查结果。所有PACG眼分为早期[−6 dB < 视野平均偏差(visual field mean deviation, VF-MD)],中期[−12 dB ≤ VF-MD ≤ −6 dB]和晚期[VF-MD < −12 dB],均测量了平均GCIPL厚度、最小GCIPL厚度以及鼻上、上方、颞上、颞下、下方、鼻下GCIPL厚度;平均RNFL厚度以及上方、下方、颞侧和鼻侧RNFL厚度;盘沿面积、视盘面积、平均杯盘比、垂直杯盘比和杯容积等参数,并比较各组间参数。结果:早期与中期PACG眼相比,黄斑GCIPL厚度和视网膜RNFL厚度之间均无差异(p > 0.05)。晚期与中期PACG眼相比,上方和颞上黄斑GCIPL厚度明显变薄(p = 0.019, 0.049),下方RNFL厚度明显变薄(p = 0.011)。早期与晚期PACG眼的黄斑GCIPL厚度和视网膜RNFL厚度之间均存在差异(p < 0.05)。早期与中期PACG眼的盘沿面积、平均杯盘比、垂直杯盘比和杯容积之间均无差异(p > 0.05)。晚期与中期PACG眼相比,平均杯盘比、垂直杯盘比和杯容积明显增高(p < 0.05)。早期与晚期PACG眼的盘沿面积、平均杯盘比、垂直杯盘比和杯容积之间均存在差异(p < 0.05)。结论:PACG的眼底损害在中期、晚期进展明显,尤其上方和颞上黄斑GCIPL厚度明显变薄,下方RNFL厚度明显变薄,与RNFL和黄斑GCIPL厚度相比,视盘参数存在差异。
Abstract:
Purpose: To compare the macular ganglion cell layer (GCIPL) thickness and retinal nerve fiber layer (RNFL) thickness measured by spectral-domain optical coherence tomography (SD-OCT) in eyes with early, moderate and severe primary angle-closure glaucoma (PACG). Methods: In this retrospective study, 36 eyes with PACG were included. They all underwent the spectral-domain optical coherence tomography (SD-OCT). The subjects with PACG were further classified as the early [−6 dB < visual field mean deviation (VF-MD)], moderate [−12 dB ≤ VF-MD ≤ −6 dB], or severe [VF-MD < −12 dB] PACG. The average, minimum, and sectoral (superonasal, superior, superotemporal, inferotemporal, inferior, inferonasal) parameters were used to determine the macular GCIPL thickness. The average, superior, inferior, temporal, and nasal quadrant thicknesses were included in the analysis with regard to the peripapillary RNFL thickness measurements. Individual parameters in the ONH measurements included rim area, disc area, average cup to disc ratio, vertical cup to disc ratio, and cup volume. Results: The macular GCIPL and the RNFL thickness in eyes with early PACG and those in eyes with moderate PACG were not substantially different (all p > 0.05). The GCIPL was significantly thinner in the severe PACG eyes compared with the moderate PACG eyes at the superior and superotemporal macular locations (p = 0.019, 0.049). The RNFL was significantly thinner in the severe PACG eyes compared with the moderate PACG eyes at the inferior optic disc locations (p = 0.011). There were significant differences between the macular GCIPL and RNFL thickness in the eyes with early PACG and those in the eyes with severe PACG (all p < 0.05). There was no significant difference in the rim area, average cup to disc ratio, vertical cup to disc ratio, and cup volume between the early and moderate PACG eyes (all p > 0.05). When compared to the moderate PACG eyes, the average cup to disc ratio, vertical cup to disc ratio, and cup volume in the severe PACG eyes were substantially different (all p < 0.05). There were significant differences in the rim area, average cup to disc ratio, vertical cup to disc ratio, and cup volume between the early and severe PACG eyes (all p < 0.05). Conclusions: The fundus damage of PACG progressed significantly in the moderate and severe stages, especially the thickness of GCIPL in the superior and superotemporal macular locations was significantly thinner, and the thickness of RNFL in the inferior locations was significantly thinner. Compared with the thickness of RNFL and macular GCIPL, the optic disc parameters were different.
1. 引言
原发性闭角型青光眼(primary angle-closure glaucoma, PACG)是全球范围内导致不可逆失明的主要原因之一。到2040年,PACG的患病人数预计将达到3204万人 [1]。许多研究表明,与原发性开角型青光眼(primary open angle glaucoma, POAG)相比,PACG发生严重双眼视力障碍甚至失明的风险要高出三倍 [2]。PACG通常与女性、浅前房、晶状体厚度增加、远视和短眼轴有关 [3] [4]。
PACG患者会表现为特征性视神经损伤和视野缺损。在PACG的早期阶段,如临床前期、间歇期,或原发性房角关闭和可疑房角关闭阶段,并没有出现明确的视神经损伤或视野缺损 [5]。随着疾病的进展,PACG患者的视野损害加重 [6]。目前还没有PACG患者疾病发展的不同时期黄斑区GCIPL厚度、RNFL厚度和视盘相关参数的研究。因此,本研究旨在通过SD-OCT检测早期、中期及晚期PACG患者间黄斑GCIPL、RNFL厚度损失和视盘相关参数,比较各期之间的差异,以期为 PACG患者早期诊断提供依据。
2. 资料与方法
2.1. 资料
这项回顾性横断面研究选取了2019年7月至2020年12月在我院就诊的PACG患者36例(36眼)。对所有受试者进行了相关眼科检查,包括视力、角膜厚度测量、非散瞳验光、眼轴测量、裂隙灯检查、房角镜检查、眼底检查、视野分析和频域OCT (spectral-domain optic coherence tomography, SD-OCT)。
PACG患者的入选标准包括:① 年龄 > 18 岁,② 最佳矫正视力至少为0.5,③ 眼压 > 21 mmHg,④ 前房角镜检查确认房角关闭,⑤ 存在青光眼性视盘神经病变:杯盘比(C/D)差 ≥ 0.2、垂直杯盘比 > 0.6或视盘出血,⑥ 无眼科手术史和青光眼家族史。根据视野平均偏差(VF-MD),将患者进一步分为早期(−6 dB < VF-MD)、中度(−12 dB ≤ VF-MD ≤ −6 dB)或重度VF-MD < −12 dB) PACG [7]。为了使VF-MD更加精确,假阳性和假阴性率均低于15%。
2.2. SD-OCT检查方法
被检者正常瞳孔下,暗室环境中采用CIRRUS SD-OCT用于获取黄斑扫描和视盘周围RNFL扫描(Carl Zeiss Meditec, Inc.)图像。SD-OCT设备软件的神经节细胞分析(GCA)算法用于计算基于中央凹的6 * 6 * 2 mm3立方体内的黄斑GCIPL厚度。在相应区域内,测量GCIPL扇形厚度(垂直内径1 mm,外径4 mm,水平内径1.2 mm,外径4.8 mm) [8] [9] [10]。平均、最小和扇形(鼻上、上方、颞上、颞下、下方、鼻下象限)参数用于评估黄斑GCIPL厚度测量值。
运用200 * 200轴向扫描的6 * 6 * 2 mm3立方体来构建视盘图像。通过直径为3.46毫米的圆形B扫描,算法自动检测到中央视盘并将其定位在视盘周围。然后系统确定圆上每个位置的RNFL的厚度并显示结果 [11]。平均和扇形(上方、下方、颞侧和鼻侧象限)参数用于RNFL厚度测量。ONH测量中的各个参数包括盘沿面积、视盘面积、平均杯盘比、垂直杯盘比和杯容积。
2.3. 统计学方法
使用独立样本t检验、单因素方差分析和非参数检验比较早、中、晚期PACG的RNFL厚度、黄斑GCIPL厚度和视盘参数。此外,不同组间也进行了两两比较。
所有关于参数的统计分析均使用SPSS 26.0版(SPSS Inc., Chicago, Illinois, USA)进行;p < 0.05被认为具有统计学意义。
3. 结果
3.1. 一般结果
该研究包括36眼,其中早期PACG12眼、中期PACG8眼和晚期PACG16眼。三组人口统计学资料及临床特征见表1。三组比较时眼轴和角膜厚度无显著差异,平均年龄存在差异(p = 0.025)。
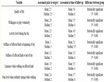
Table 1. Demographic characteristics of study subjects
表1. 入组者一般情况
3.2. SD-OCT参数
三组之间黄斑区GCIPL厚度和视盘周围RNFL厚度比较结果见表2。
Table 2. Macular GCIPL thickness parameters and RNFL thickness parameters obtained by SD-OCT
表2. GCIPL厚度和RNFL厚度
早期PACG眼的GCIPL厚度在所有象限均大于中期PACG眼,但组间差异无统计学意义(p > 0.05)。晚期PACG与中期PACG相比,各象限的GCIPL厚度都显著变薄,但只有上方和颞上有统计学上差异(p = 0.019、0.049)。晚期PACG与早期PACG相比,各象限的GCIPL厚度都变薄(p < 0.05)。
早期 PACG 眼的各象限RNFL厚度均大于中期PACG眼,但无显著差异(p > 0.05)。晚期PACG眼与中期PACG眼相比,各象限RNFL厚度均下降,但只有下方RNFL厚度有统计学差异(p = 0.011)。在RNFL厚度中,晚期PACG眼在各象限RNFL厚度都比早期PACG眼更薄(p < 0.05)。
三组视盘参数比较结果见表3。
Table 3. ONH parameters obtained by SD-OCT
表3. 视盘参数
早期与中期PACG眼的盘沿面积、平均杯盘比、垂直杯盘比和杯容积之间均无差异(p > 0.05)。晚期PACG眼与中期PACG眼相比,平均杯盘比、垂直杯盘比和杯容积明显增高(p < 0.05)。早期PACG眼与晚期PACG眼的盘沿面积、平均杯盘比、垂直杯盘比和杯容积之间均存在显著差异(p < 0.05)。
4. 讨论
青光眼是全球范围内不可逆转的致盲性眼病,但早期诊断和治疗可延缓失明。其视网膜损害的主要特征是神经节细胞的凋亡。除此之外,以往的研究表明,在青光眼的眼底进展中,视盘和RNFL的形态学改变先于视野缺损的出现 [12]。随着青光眼病情的进展,越来越多的视网膜节细胞及其轴突受到影响,从而导致视盘形态改变,杯盘比增加。
SD-OCT是一种常用的新型现代成像技术,它利用低相干干涉技术提供RNFL、GCIPL和ONH的高分辨率横断面图像,能够准确、客观地显示青光眼的解剖学上的改变。目前尚未明确哪些OCT参数在PACG的不同分期的检测中具有明显差异,可以作为青光眼早期检测的主要指标。
青光眼的早期诊断具有重要意义,但在临床上,需经过全面详细的检查和较长时间的随访与观察,才能明确诊断。大量研究证明了SD-OCT检测青光眼患者黄斑区GCIPL厚度和视盘周围RNFL厚度变化的能力 [13] [14] [15] [16]。本研究利用SD-OCT测量并比较了早、中、晚期原发性闭角型青光眼的GCIPL厚度和RNFL厚度、视盘参数的差异。
我们的研究发现,早期和晚期PACG眼的GCIPL和RNFL厚度存在显著差异。然而,在中期与晚期PACG中,仅上方和颞上象限的GCIPL厚度与下方RNFL厚度存在显著差异。早期和中期PACG的RNFL厚度和GCIPL厚度无显著差异。既往研究表明,高眼压症的平均RNFL厚度以及鼻侧、下方和颞侧象限均较正常眼薄 [17]。随着青光眼的进展,颞侧的GCIPL厚度比鼻侧象限更易受影响 [18] [19]。因此可以推测,在PACG的眼底损害进展中,颞侧GCIPL与下方RNFL更易受累,损伤更为明显。这一结论与视网膜的解剖结构密切相关,在视乳头上下极部筛孔大,形成筛孔的板层薄而细,视乳头的鼻侧筛孔大,形成的板层厚而粗,因此眼压升高后,巩膜壁的异常牵张最易累及的部位即上下和颞侧视网膜。另一方面,研究也证实,在PACG急性发作后,RNFL厚度立即增加 [20],这或许会对SD-OCT测量的指标造成干扰。
杯盘比是临床上诊断青光眼的重要指标之一,典型的青光眼视乳头改变表现为视盘凹陷增大、盘沿变窄,尤其体现在上下方,因此,通常表现为垂直杯盘比增大或双眼不对称。既往研究表明,高眼压眼与正常眼的视盘参数,除杯容积外,其余参数差异均有统计学意义 [21]。在我们的研究中,早期与晚期PACG眼的盘沿面积、平均杯盘比、垂直杯盘比和杯容积之间均存在显著差异。晚期PACG眼与中期PACG眼相比,平均杯盘比、垂直杯盘比和杯容积明显增高。早期PACG眼与中期PACG眼的视盘参数之间无明显差异。由此推断,单独的视盘面积或者盘沿面积对于早期青光眼的诊断意义不大,此外这两项指标在人群中有较大变异,视盘面积大者盘沿面积也大,反之亦然,因此,诊断价值有限。
这些结果可能表明,从早期到中期PACG,视盘和黄斑损伤的进展并不明显。从中期到晚期PACG,视盘和黄斑损伤最明显的象限分别是下方和颞上象限。
当前的研究具有一定的局限性。首先,它属于回顾性研究。其次,样本量相对较少。为进一步明确PACG眼各期之间SD-OCT相关参数之间的差异,需要更大样本量的PACG眼进行前瞻性研究。
声明
本研究已获得病人知情同意。
NOTES
*通讯作者Email: yankejiang@126.com