摘要: 目的:探讨AI定量参数对良恶性肺结节诊断价值。方法:回顾性收集2019年12月~2022年1月在延安大学附属医院经手术切术最终病理确诊的孤立性肺结节患者84例,其中肺腺癌62例,肺良性结节22例,利用人工智能软件,在薄层扫描肺窗图像上提取AI定量参数。采用独立样本t检验或非参数检验比较良恶性组患者定量参数差异,进行单因素二元logistic回归分析,并绘制ROC曲线计算曲线下面积(AUC),敏感度、特异度寻找鉴别良恶性结节的风险因素。结果:良恶性结节的一般临床基线资料差异没有统计学意义。单因素回归分析显示平均CT值、中位数、偏度是良恶性结节预测因素。多因素回归显示平均CT值是肺良恶性结节独立预测指标(OR值 = 0.995,95% CI:0.992~0.999)。ROC曲线下面积AUC = 0.770 (0.615~0.915),临界值为−165.35,灵敏度62%,特异度87.5%。结论:定量参数平均CT值、中位数、偏度能够鉴别良恶性肺结节,其中平均CT值诊断效能最优。
Abstract:
Objective: To evaluate the value of AI quantitative parameters in the diagnosis of benign and ma-lignant pulmonary nodules. Methods: A total of 84 patients with lung solitary pulmonary nodule, including 62 cases of adenocarcinoma and 22 cases of benign pulmonary nodules, were retrospec-tively collected from December 2019 to January 2022 in the affiliated hospital of Yan’an university, using artificial intelligence software, AI quantitative parameters were extracted from thin-slice lung window images. The differences in quantitative parameters between benign and malignant groups were compared by independent-sample t-test or nonparametric test, and univariate binary logistic regression analysis was performed. The area under the curve (AUC) was calculated by plotting the ROC curve, sensitivity and specificity were used to identify the risk factors of benign and malignant nodules. Results: The General Clinical Baseline data for benign and malignant nodules were not sta-tistically significant. Univariate regression analysis showed that mean CT value, median and skew-ness were predictive factors of benign and malignant nodules. Multivariate regression analysis showed that the mean CT value was an independent predictor of benign and malignant pulmonary nodules (OR = 0.995, 95% CI: 0.992~0.999). The area under the ROC curve was AUC = 0.770 (0.615~0.915), the critical value was −165.35, the sensitivity was 62%, the specificity was 87.5%. Conclusion: The mean value, median value and skewness of quantitative parameters could differen-tiate benign and malignant pulmonary nodules, and the mean value of CT was the best.
1. 引言
目前,肺癌是全球发病率及病死率均较高的恶性肿瘤之一,早期很难被发现,一旦被发现基本已到晚期。临床研究发现,孤立性肺结节的检出对诊断肺癌意义重大。晚期肺癌患者5年生存率仅为18%,而早期肺癌患者治疗后5年生存率可达90%以上 [1]。但早期肺癌患者通常无症状,不易发现,一旦出现临床症状,大多已进入晚期。因此,提高肺癌患者的治愈率和预后取决于早期诊断和早期治疗 [2]。人工智能(artificial intelligence, AI)作为当前科学技术发展中的一门广泛应用于医学领域的前沿学科,对肺结节进行检测是人工智能医疗发展的重要方向 [3]。基于深度学习的人工智能(AI)可识别人眼无法辨别的微小病变,具有更高的敏感性和可重复性,可明显提高肺结节检出率 [4]。越来越多的研究证实AI不仅能够分析结节影像学特征,还能鉴别肺结节的性质及肺癌的病理学类型。研究发现影像组学及定量参数可提供肿瘤形态、结构、瘤内异质性等相关特征定量信息,在肺结节性质、肿瘤组织亚型、浸润程度判别,甚至提供预后相关信息等方面发挥重要作用 [5],因此术前准确区分肺结节的良恶性对于患者有重要意义。
2. 资料与方法
2.1. 研究对象
回顾性收集2019年12月至2022年1月在延安大学附属医院经手术切术最终病理确诊的孤立性肺结节患者84例,肺腺癌62例,肺良性结节22例。纳入标准:1) 良恶性结节符合《胸部CT肺结节数据集构建及质量控制专家共识(2021版)》 [6] 相关诊断标准;2) 胸部CT图像层厚 ≤ 1.25 mm;3) 有术后病理学检查完整结果。4) 结节直径 ≤ 3 cm。排除标准:1) CT薄层图像不完整。2) 患者有手术及放化疗史。3) 肺结节病理结果为肺鳞癌、小细胞肺癌。
2.2. CT扫描技术
所有检查由联影UCT-760 128层进行扫描。扫描过程中,患者取仰卧位,从肺尖到肺底进行全肺扫描。扫描参数:管电压120 KV,自动管电流80 mAs,准直40 mm,螺距1.0875,转速0.5 s/r,旋转时间0.5 s,最小层厚0.625 mm,矩阵1024 × 1024,标准算法重建。
2.3. 肺结节检测定量指标
基于深度学习模型的人工智能软件由联影医疗公司提供。将84例胸部CT原始数据导入联影人工智能软件后台。该软件系统可自动识别和分析肺结节。定量指标包括:结节长径(mm)、短径(mm)、2D平均直径(mm)、CT最大值(HU)、CT最小值(HU)、CT平均值(HU)、体积(mm3)、质量(mg)等(图1)。
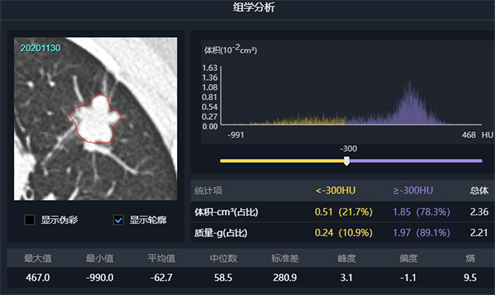
Figure 1. Quantitative parameters index of pulmonary nodules extracted by AI software
图1. AI软件提取的肺结节定量参数指标
2.4. 统计学方法
采用SPSS26.0进行统计学分析。采用独立样本t检验或非参数检验比较肺癌与肺良性结节患者CT定量参数的差异。将P < 0.05的指标进行logistic分析找出预测良恶性的指标。对两组间差异有统计学意义的变量参数绘制受试者工作特征表(ROC)曲线,分析各定量参数最佳诊断阈值,获得曲线下面积,敏感度和特异度。
3. 结果
3.1. 良恶性结节一般临床资料
良恶性结节平均年龄分别为(52.38 ± 11.91)岁、(58.52 ± 10.66)岁,两组间年龄分布差异无统计学意义(P = 0.081)。性别、吸烟史和BMI在两组间无统计学差异(均P > 0.05) (表1)。
3.2. CT定量指标良性组及恶性组组间差异
肺结节的长径、短径及2D平均直径差异均无统计学意义(P > 0.05);平均CT值,中位数及偏度差异有统计学意义(P < 0.05) (见表2)。
Table 1. Demographic data of benign nodule group and malignant nodule group
表1. 良性结节组及恶性结节组人口统计学数据
Table 2. The difference of CT quantitative indexes between benign group and malignant group
表2. 良性组与恶性组CT定量指标的组间差异
3.3. Logistic回归分析及诊断效能评价
将两组间差异显著的3个定量指标纳入Logistic回归分析,其中平均CT值、中位数、偏度差异有统计学意义(P < 0.05)。多因素回归分析显示平均CT值差异有统计学意义(P < 0.05)。ROC曲线分析显示,平均CT值、中位数、偏度的ROC曲线下面积(AUC)值分别为0.770、0.760和0.769 (P < 0.05,表3~5;图2)。
Table 3. Results of univariate Logistic regression analysis for differentiating benign from malignant pulmonary nodules
表3. 区分肺良恶性结节单因素Logistic回归分析结果
Table 4. Results of multivariate Logistic regression analysis for differentiating benign from malignant pulmonary nodules
表4. 区分肺良恶性结节多因素Logistic回归分析结果
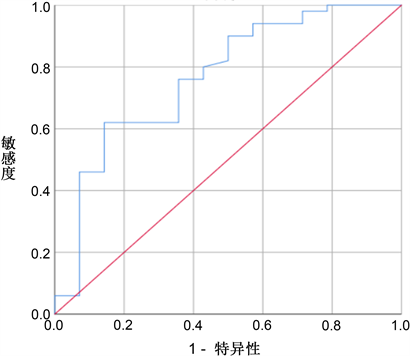
Figure 2. Average CT value ROC curve
图2. 平均CT值ROC曲线
Table 5. Efficacy of univariate parameters in differential diagnosis of benign and malignant pulmonary nodules
表5. 各单因素参数鉴别肺结节良恶性的效能
4. 讨论
由于恶性肺癌的高发病率和死亡率高,其早期诊断和治疗越来越受到重视,作为重要的早期标志物,其性质的鉴别一直是临床工作的重点和难点 [7]。近年来,流行病学研究表明,肺癌的发病率和死亡率呈上升趋势 [8]。随着肺癌早期筛查在人群中的逐步普及和肺结节检出率的大幅度提高,进一步增加了其在临床工作中的性质评价和鉴别的挑战。
此外,采用低剂量计算机断层扫描(LDCT)筛查高危人群以提高早期肺癌的诊断效果和预后已成为众多国际权威医疗组织的共识 [9]。CT对肺结节和早期肺癌的检测具有较高的敏感性。低剂量CT早期发现肺结节对于肺癌的诊断和治疗非常重要。人工智能辅助诊断系统可以减少人工参与诊断过程,避免主观偏差,提高分析的效率和客观性 [10]。
本研究发现CT平均值、中位数及偏度对于鉴别良恶性结节有诊断价值,它们诊断价值相似,其中CT平均值的AUC略高于其他。有研究发现CT平均值变化能够反映肺结节的恶性程度,尤其在鉴别肺磨玻璃结节肺腺癌病理亚型方面 [11] [12]。本研究发现区分良恶性结节的平均CT值的阈值为−165.35 HU,诊断良恶性结节的效能为0.770,诊断效能较好。本研究中三个有意义指标代表了结节密度特征,其中偏度反映了结节CT值分布的对称性。CT平均值反映了结节CT值的均值。三个指标都是根据结节的密度特征进行量化。本研究对多因素进行逻辑回归分析发现平均CT值是预测肺良恶性结节的独立预测指标。CHEN等 [13] 研究发现,肺结节小于10 mm是鉴别其良恶性的一个关键因素,本研究发现长径、短径及2D平均直径无统计学意义,可能是由于我们这次研究纳入了 ≤ 3 cm的所有结节而且并未对结节类型进行分组进行比较。有文献认为理想的肺结节诊断、预测和预模型应是综合模型,除组学特征外可纳入组织学、血清标志物、病史等特征 [14]。根据共识可知吸烟史及肺癌家族史是肺癌的高发因素 [6],本研究发现良恶性结节组中吸烟史差异没有统计学意义,可能由于样本量不足导致,后期应进一步加大样本量。术前癌胚抗原(Carcinoembryonic antigen, CEA),细胞角蛋白19片段(cytokeratin 19 fragment 21-1, CYFRA21-1)、白介素6 (interleukin-6, IL-6)和白介素8 (interleukin-8, IL-8)血清水平对于鉴别良恶性肺结节有一定诊断价值 [15]。后期可以进一步纳入血清指标建立综合预测模型提高良恶性结节诊断效能。
5. 总结
本研究的局限性:1) 本研究对良恶性结节整体分析,并未对结节按密度特征进行分组。2) 本研究样本量较少,后期应加大样本量进一步分析。3) 本文未纳入组织学、血清标志物进行分析。
综上所述,本研究发现AI定量参数CT平均值、中位数、偏度对良恶性结节鉴别有诊断价值,其中多因素回归分析显示平均CT值是预测良恶性结节的最佳预测指标。
NOTES
*第一作者。
#通讯作者。