摘要: 目的:基于CT的影像组学组学特征联合CT图像特征建立影像组学列线图,验证其在≤4 cm肾透明细胞癌(ccRCC)与肾乏脂肪血管平滑肌脂肪瘤(AML.wovf)之间的鉴别效能。方法:回顾性分析149例肾透明细胞癌(n = 102)和肾乏脂肪血管平滑肌脂肪瘤(n = 47)患者。从皮髓期、实质期及排泄期CT图像中提取影像组学特征,并计算影像组学评分(Radscore)。评估CT特征及一般临床因素建立图像特征模型。结合Radscore和独立的图像特征,绘制影像组学列线图,并从拟合度、鉴别效能和临床实用性方面对列线图进行评估。结果:影像组学列线图(曲线下面积(AUC),0.979;95%置信区间(CI),0.962~0.996)与影像组学特征(AUC, 0.972; 95%CI, 0.949~0.994)及图像特征模型(AUC, 0.933; 95%CI, 0.897~0.970)相比,显示出更好的鉴别效能。决策曲线分析显示列线图的临床实用性优于影像组学特征和图像特征模型。结论:基于CT的影像组学列线图是一种无创的术前预测工具,在鉴别AML.wovf和ccRCC显示出良好的预测效果,这可能有助于临床医生制定精确的治疗方案。
Abstract:
Objective: CT based radiomics features combined with CT image features to establish radi-omicsnomogram and verify its discriminant effectiveness between ≤4 cm clear cell renal cell carci-noma and renal angiomyolipoma without visible fat (AML.wovf). Methods: 149 patients with ccRCC (n = 102) and AML.wovf (n = 47) were retrospectively analyzed. The imaging group characteristics were extracted from the CT images of the corticomedullary, parenchymal and excretory phases, and the radiomic score (Radscore) was calculated. Evaluating CT features and general clinical factors to establish image feature model. Combined with Radscore and independent image features, the ra-diomics nomogram was drawn, and the nomogram was evaluated from the aspects of fitting, dis-crimination efficiency and clinical practicability. Results: Radiomicsnomogram (area under curve (AUC), 0.979; 95% confidence interval (CI), 0.962~0.996) showed better discrimination efficiency compared with the radiomics features (AUC, 0.972; 95%CI, 0.949~0.994) and image features (AUC, 0.933; 95%CI, 0.897~0.970). The decision curve analysis showed that the clinical practicability of nomogram was better than that of radiomics features and CT image features model. Conclusion: CT based radiomics nomogram is a non-invasive preoperative prediction tool, which shows good pre-diction effect in distinguishing AML.wovf and ccRCC, which may help clinicians to formulate accurate treatment plans.
1. 引言
近年来肾肿瘤的检出率在不断提高,其中有很多是小肾癌和良性肾肿瘤 [1] 。肾透明细胞癌是最常见的肾癌亚型 [2] ,T1a期(肿瘤局限于肾脏且最大径 ≤ 4 cm)肾透明细胞癌的治疗方式首选保留肾单位手术(NSS) [3] 。血管平滑肌脂肪瘤(Angiomyolipoma, AML)是最常见的良性肾肿瘤 [4] ,约5%的AML无肉眼可见的脂肪(AML.wovf),≤4 cm的AML的首选治疗方案是保守治疗 [5] 。CT检查是肾脏肿瘤的首选检查方式 [6] ,AML.wovf与ccRCC的影像表现有许多相似之处,二者经常出现误诊或无法鉴别,这也常导致活检或不必要的手术发生。
近年来,影像组学的进步改进了定量统计特征的高通量提取过程,使图像转换为可挖掘量化数据,这些数据的分析有助于肿瘤患者更好的临床决策 [7] 。本研究建立并验证影像组学列线图在≤4 cm肾透明细胞癌与肾乏脂肪血管平滑肌脂肪瘤之间的鉴别价值。
2. 资料与方法
2.1. 患者资料
这项回顾性研究获得了机构审查委员会的批准,放弃了患者知情同意。回顾性分析2018年5月至2021年12月份入组的149例患者资料,其中,ccRCC102例,AML.wovf47例,男93例,女56例,年龄28~85岁,平均年龄(54.10 ± 12.06)岁,临床表现:6例患者表现为腰痛,2例患者有肉眼血尿,141例患者无明显症状。
2.2. 纳入及排除标准
纳入标准:① 病理证实为ccRCC或AML;② 患者拥有完整的CT及临床资料;③ 肿瘤最大径 ≤ 4 cm;
排除标准:① 图像存在明显的伪影;② 患者在行CT检查时做过放疗或化疗;③ 血管平滑肌脂肪瘤内存在明显脂肪。
2.3. 图像特征模型(图1(a)~(d))
两名影像诊断医师在对患者的临床、实验室及病理信息均不知情的情况下分别对149例小肾肿瘤患者增强CT图像上平扫高密度、劈裂征、啤酒溢出征、假包膜征象进行评估,在出现不一致的情况下进行协商,并使用协商后的数据进行分析。1) 平扫高密度:表现为平扫肿瘤密度高于周围肾实质密度;2) 假包膜征象:表现为皮髓期肿瘤边缘出现的窄的低密度环,实质期或排泄期肿瘤边缘出现环形强化3) 劈裂征:肿瘤在肾实质部分的肿瘤边缘角度 ≤ 90˚;4) 啤酒溢出征:肿块隆起部分与相邻肾包膜之间的接触长度 ≥ 3 mm。将CT图像特征联合患者一般临床因素构建图像特征模型。
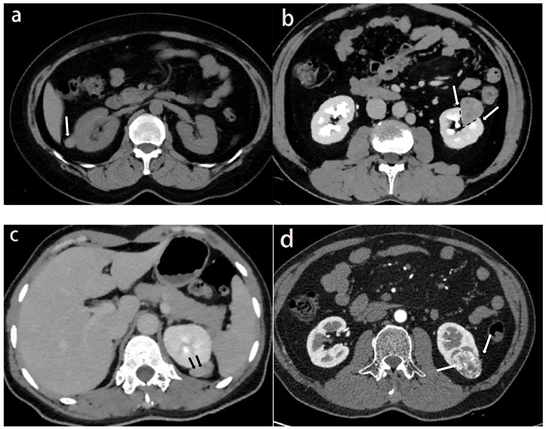
Figure 1. (a) The patient, female, 44 years old, has AML in the right kidney (white arrow). The density of tumor on non- contrast enhanced scan is slightly higher than that of normal renal parenchyma; (b) The patient, male, 45 years old, has left renal AML, and the tumor has split sign (black dotted line and white arrow) in the renal parenchyma; (c) The patient, female, 54 years old, has left renal AML, and the beer overflow sign (black arrow) can be seen at the junction of the tumor and the renal capsule; (d) The patient was a 53-year-old male with left kidney ccRCC. The pseudocapsule sign (white arrow) was seen at the margin of the tumor in the corticomedullary stage
图1. (a) 患者女性,44岁,右肾AML (白色箭头),肿瘤平扫密度略高于正常肾实质密度;(b) 患者男性,45岁,左肾AML,肿瘤在肾实质内可见劈裂征(黑色虚线和白色箭头);(c) 患者女性,54岁,左肾AML,肿瘤与肾包膜交界处可见啤酒溢出征(黑色箭头);(d) 患者男性,53岁,左肾ccRCC,皮髓期肿瘤边缘可见假包膜征象(白色箭头)
2.4. 影像组学特征
2.4.1. 肿瘤三维分隔
使用ITK-SNAP软件第3.8.0版对感兴趣区域(ROI)进行三维(3D)分割。在皮髓期、实质期及排泄期图像上的肿瘤边界内绘制轮廓,但避免覆盖相邻的肾实质和肾周脂肪。手动分割的示例如图2所示。
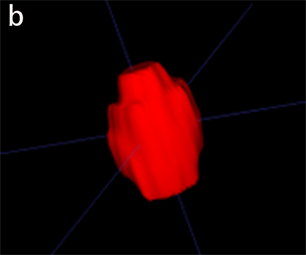
Figure 2. (a) Tumor segmentation on axial images; (b) Three-dimensional volume reconstruction
图2. (a) 轴位图像上的肿瘤分割;(b) 三维容积重建
2.4.2. 影像组学特征提取
本研究使用深睿多模态研究平台进行影像组学特征提取。首先,使用B样条插值重采样技术执行预处理,对所有CT图像进行重采样,使其为0.75 × 0.75 × 0.75 mm3体素。然后,从皮髓期、实质期及排泄期增强CT图像的ROI中提取1144个特征。提取的放射组学特征分为三类:1) 基于肿瘤形状和大小的特征、一阶灰度统计特征;2) 基于纹理的特征,包括灰度共生矩阵(GLCM)、灰度大小区域矩阵(GLSZM)、灰度游程矩阵(GLRLM)和灰度差矩阵(GLDM)。3) 更高阶的统计特征,包括从使用2种类型的滤波器(对数和小波变换)处理的图像中导出的强度和纹理特征。使用观察者间组内相关系数(intraclass correlation coefficients, ICC)来筛选具有更好鲁棒性的影像组学特征。医师a和医师b独立地描绘了30名患者的皮髓期、实质期及排泄期的ROI。两周后,医师a再次勾画这30名患者的ROI,ICC > 0.75的特征被认为是一致的,并保留以供进一步分析。然后使用LASSO回归算法进行影像组学特征的进一步筛选,使用10折交叉验证选择模型中的最优调和参数用于压缩模型系数(将无关变量的系数降于零,保留非零系数的变量)。对所选影像组学特征进行Logistic逻辑回归分析,并根据回归方程计算三期影像组学得分。联合三期图像所有特征进行上述处理,得到三期联合影像组学得分(Radscore)。
2.5. 影像组学列线图的绘制和验证
影像组学列线图整合了影像组学特征(Radscore)、独立的图像特征和患者一般临床因素。绘制ROC曲线,使用ROC曲线下面积(AUC)评估影像组学特征、CT图像特征模型和影像组学列线图的对于ccRCC和AML.wovf的鉴别效能。使用Hosmer-Lemeshow拟合优度检验评价列线图的拟合度。使用决策曲线分析来量化不同阈值概率下的净收益,以评估影像组学列线图、影像特征模型和CT图像特征模型的临床实用性。
2.6. 统计学分析
使用SPSS版本23.0进行单因素分析。计量资料符合正态分布用c ± S表示,非正态分布用中位数(四分位数间距)表示,计数资料用数值(百分比)表示。组间比较,计量资料采用独立样本t检验或Mann-Whitney U检验,计数资料采用c2检验或Fisher确切概率法。P < 0.05被认为具有统计学意义。使用深睿多模态研究平台进行LASSO回归模型分析、多变量二元logistics回归模型和列线图构造,并绘制ROC曲线和决策曲线。
3. 结果
3.1. 图像特征模型
ccRCC和AML.wovf组间比较见表1。结果显示两组平扫高密度、假包膜征象、劈裂征、啤酒溢出征、年龄和性别差异具有统计学意义(P均<0.05)。AML.wovf平扫多呈高密度,多有劈裂征和啤酒溢出征CT征象。ccRCC多有假包膜征象,患者年龄更大,更倾向于男性患者。
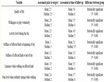
Table 1. ccRCC and AML.wovf intergroup comparison
表1. ccRCC和AML.wovf组间比较
3.2. 影像组学列线图的建立和验证(见图3)
结合年龄、性别、CT征象和Rad评分绘制影像组列线图。回归方程为:Ln(P/1 − P) = 1.1352 − 1.9845 × Radscore − 1.0706 × 平扫高密度 + 0.5496 × 假包膜征象 − 0.3087 × 啤酒溢出征 − 0.1258 × 劈裂征 + 0.2733 × 年龄 + 0.1015 × 性别。Hosmer-Lemeshow拟合优度检验差异无统计学意义(P = 0.948),表明模型未偏离拟合。
3.3. 影像组学列线图、影像组学特征和图像特征模型的鉴别效能
结果显示影像组学列线图的诊断效能最好(见表2),影像组学列线图和影像组学特征的ROC曲线如图4所示。并绘制影像组学列线图得分图(图5)。决策曲线分析见图6。
Table 2. Discriminant effectiveness of radiomics nomogram, radiomics features and image features model
表2. 影像组学列线图、影像组学特征和图像特征模型的鉴别效能
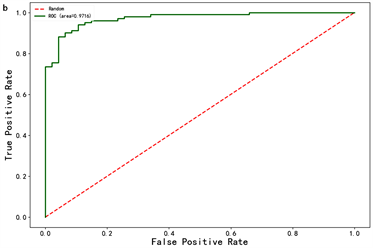
Figure 4. ROC curves of radiomics nomogram (a) and radiomics features (b)
图4. 影像组学列线图(a)和影像组学特征(b)的ROC曲线
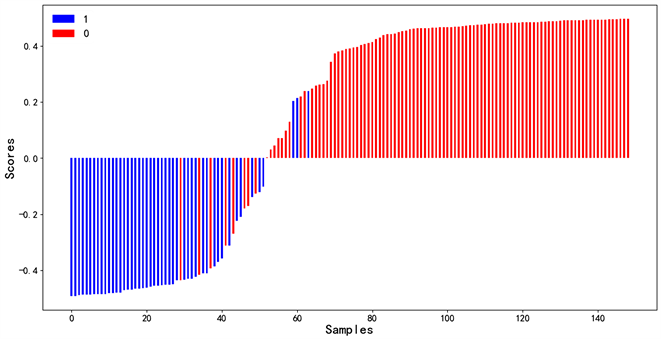
Figure 5. Radiomics nomogram score for each patient. The red bar represents the score of the ccRCC patient, while the blue bar represents the score of the AML.wovf patient
图5. 每个患者的影像组学列线图得分。红色条代表ccRCC患者的分数,而蓝色条代表AML.wovf患者的分数
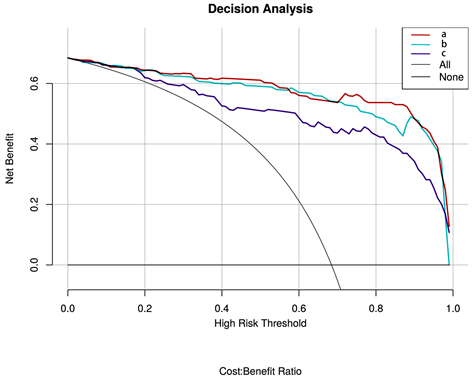
Figure 6. Decision curve analysis, (a) Radiomics nomogram; (b) Radiomics features; (c) Image features model. The vertical axis represents the net benefit, and the horizontal axis represents the threshold probability
图6. 决策曲线分析,(a) 影像组学列线图;(b) 影像组学特征;(c) 图像特征模型。纵轴表示净效益,横轴表示阈值概率
4. 讨论
肾透明细胞癌和乏脂肪血管平滑肌脂肪瘤在CT上不能可靠的诊断与鉴别,特别是≤4 cm的T1a期肾肿瘤 [8] 。本研究绘制了鉴别二者的影像组学列线图并评估了其鉴别效能和临床实用性,结果显示:影像组学列线图(曲线下面积(AUC),0.979;95%置信区间(CI),0.962~0.996)的鉴别效能优于影像组学特征(AUC, 0.972; 95%CI, 0.949~0.994)及图像特征模型(AUC, 0.933; 95%CI, 0.897~0.970)。决策曲线分析显示列线图的临床实用性优于影像组学特征和图像特征模型。
CT征象有助于鉴别ccRCC和AML.wovf。有学者认为假包膜征象是肾脏恶性肿瘤的标志 [9] ,尤其是肾透明细胞癌 [10] ,Yang等 [11] 回顾了132例肾肿瘤患者的CT三期增强图像,发现劈裂征、平扫肿瘤周围低密度边缘、肿瘤均匀强化和CT平扫上无钙化的高衰减能够区分ccRCC和AML.wovf。Kim等 [12] 通过回顾性分析602例(n = 49)和RCC (n = 553)的CT图像,发现劈裂征和啤酒溢出征有助于鉴别RCC和AML.wovf (AUC值分别为0.871、0.943,敏感性为0.55、0.61,特异性为0.82、0.97),这与本文的结果一致。
先前有许多学者关于影像组学鉴别RCC和AML.wovf做出研究:Yang等 [13] 从平扫和三期增强CT图像中肿瘤最大层面勾画2DROI,并提取影像组学特征,使用多个机器学习模型进行分析验证,发现RCC与AML.wovf鉴别效能最佳的机器学习模型是“SVM + t-score”和“SVM + relief”(AUC值均为0.9,敏感度均为0.83,特异度分别为0.78和0.82)。Hodgdon等 [14] 开发了CT纹理模型,以使用支持向量机(SVM)分类器在CT平扫图像上区分16个AMLs.wovf和84个RCC,结果AUC为0.89。Ma等 [15] 得出与传统CT分析相比,CT影像组学的诊断符合率提高,CT三期组合(平扫期 + 皮髓质期 + 实质期)的影像组学特征的AUC为0.988。Nie等 [16] 开发和验证了影像组学列线图用于鉴别AML.wovf与均质ccRCC,纳入了36例AML.wovf和63例均质ccRCC,从增强CT皮髓期和实质期3D容积ROI中提取数据,模型AUC值为0.896,敏感度和特异度分别为0.96和0.77。
假包膜征象、平扫高密度、劈裂征及啤酒溢出征这些CT征象对于ccRCC和AML.wovf的鉴别具有重要的作用,影像组学能够提供肉眼无法识别的差异,对二者的鉴别起到了进一步的帮助。此外,本研究相较于之前研究存在一些差异和改进。第一,本研究勾画了3D容积ROI并使用三期图像以更全面的提取的影像组学特征。第二,本文选择研究的是≤4 cm的小肾肿瘤,CT对于小肾肿瘤定性及鉴别较为困难,而影像组学特征可以帮助鉴别诊断。
本研究也存在一定的局限性:1) 病例数较少,尤其是AML.wovf,结果可能存在一定的偏倚;2) 肿瘤3D容积ROI需要手动勾画,过程费时费力且存在一定的误差。因此多中心、大样本的研究很有必要,肿瘤自动分割是也是未来研究的方向。
综上,本研究开发和验证了鉴别≤4 cm的ccRCC和AML.wovf术前CT影像组学列线图,具有很高的敏感度和特异性,对于帮助临床决策和减少不必要的手术具有重要价值。
NOTES
*第一作者。
#通讯作者。